 B
B
Municipalities
Beaufort West Local Municipality (WC053)
Metropolitan, district, and local municipalities across South Africa.
Overview
Beaufort West Local Municipality (WC053) is responsible for municipal services, local governance, and development planning within its jurisdiction. It manages community services, local infrastructure programmes, and administrative systems that enable service delivery and local economic activity. This page provides a structured public reference for key municipal information.
Geography, History & Economy
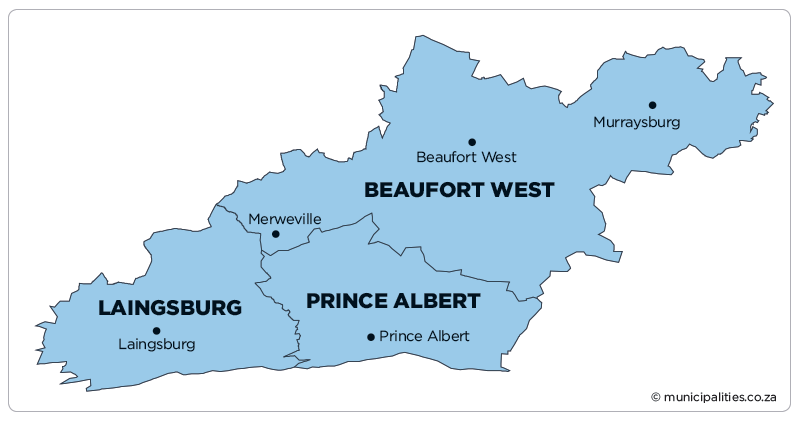
Beaufort West Local Municipality is part of Central Karoo District Municipality .
MDB code: WC053
Description: The Beaufort West Local Municipality is a Category B municipality located within the Central Karoo District in the Western Cape Province. It is bordered by the Northern Cape to the north and west, Prince Albert to the south, and the Eastern Cape to the east. It is the largest municipality of three in the district, making up more than half its geographical area. Beaufort West is the oldest municipality in South Africa. The new district was proclaimed on 27 November 1818. The then governor of the Cape, Lord Charles Somerset, named the town and district 'Beaufort' in honour of his father, the 5th Duke of Beaufort. To avoid confusion with KwaMaqoma (Fort Beaufort) and Port Beaufort, the name 'Beaufort' was changed to Beaufort West in the 1860s. In December 1994, the former black township Kwa-Mandlenkosi was amalgamated with Beaufort West Municipality. In December 2000, the rural towns of Merweville and Nelspoort were also incorporated as part of the Beaufort West Municipality.
Area: 21 917km²
Cities/Towns: Beaufort West, Merweville, Murraysburg, Nelspoort
Main Economic Sectors: Municipality and general government (22.4%), transport, storage and communication (17.1%), wholesale and retail trade, catering and accommodation (15.5%). As contribution to GDP - Source IDP 2022-2027
Open Tenders
View all →Map
Council & Management
Demographic Information
| 2022 | 2016 | 2011 | |
| Population | 72 972 | 51 080 | 49 586 |
| Age Structure | |||
| Population under 15 | 27.7% | 26.6% | 31.5% |
| Population 15 to 64 | 65.8% | 66.5% | 62.6% |
| Population over 65 | 6.5% | 6.9% | 5.9% |
| Dependency Ratio | |||
| Per 100 (15-64) | 52.0 | 50.5 | 59.7 |
| Sex Ratio | |||
| Males per 100 females | 91.4 | 92.7 | 94.8 |
| Population Growth | |||
| Per annum | 3.75% | 0.67% | n/a |
| Labour Market | |||
| Unemployment rate (official) | n/a | n/a | 25.5% |
| Youth unemployment rate (official) 15-34 | n/a | n/a | 34.5% |
| Education (aged 20 +) | |||
| No schooling | 5.2% | 5.4% | 10.1% |
| Matric | n/a | 31.8% | 23.6% |
| Higher education | 6.8% | 3.8% | 6.3% |
| Household Dynamics | |||
| Households | 19 216 | 14 935 | 13 088 |
| Average household size | 3.8 | 3.4 | 3.8 |
| Female headed households | n/a | 39.8% | 37.7% |
| Formal dwellings | 99.4% | 99.6% | 97.9% |
| Housing owned | n/a | 66.4% | 60.7% |
| Household Services | |||
| Flush toilet connected to sewerage | 98.0% | 95.3% | 92.4% |
| Weekly refuse removal | 79.6% | 91.7% | 83.7% |
| Piped water inside dwelling | 87.2% | 77.9% | 81.3% |
| Electricity for lighting | 97.3% | 96.0% | 92.0% |
Financial Results
| All values: R'000 | 2024/25 | 2023/24 | 2022/23 | 2021/22 | 2020/21 |
| AUDIT OUTCOME | n/a | Qualified audit | Qualified audit | Qualified audit | Qualified audit |
| FINANCIAL PERFORMANCE | |||||
| Property rates | 55 326 | 46 614 | 45 597 | 45 484 | 42 007 |
| Service charges | 164 388 | 107 695 | 127 431 | 131 052 | 121 140 |
| Investment revenue | 3 059 | 2 684 | 2 121 | 541 | 192 |
| Transfers recognised - operational | 99 321 | 115 122 | 92 215 | 81 643 | 89 882 |
| Other own revenue | 115 206 | 134 252 | 65 563 | 42 697 | 49 565 |
| Total Revenue (excluding capital transfers and contributions) | 437 301 | 406 366 | 332 927 | 301 417 | 302 787 |
| Employee costs | 133 434 | 124 332 | 125 625 | 124 977 | 122 961 |
| Remuneration of councillors | 6 536 | 6 018 | 6 266 | 6 173 | 6 228 |
| Depreciation and amortisation | 31 601 | 26 493 | 20 847 | 24 299 | 21 321 |
| Finance charges | 10 862 | 4 464 | 8 284 | 11 384 | 11 370 |
| Inventory consumed and bulk purchases | 127 427 | 107 283 | 91 752 | 90 747 | 84 154 |
| Transfers and subsidies | - | - | 588 | 500 | 615 |
| Other expenditure | 154 215 | 136 701 | 115 838 | 69 203 | 107 499 |
| Total Expenditure | 464 075 | 405 290 | 369 200 | 327 283 | 354 149 |
| Surplus/(Deficit) | (26 775) | 1 076 | (36 273) | (25 866) | (51 362) |
| Transfers and subsidies - capital (monetary allocations) | 27 725 | 15 945 | 52 314 | 14 812 | 22 446 |
| Transfers and subsidies - capital (in-kind) | 460 | 285 | 2 965 | 794 | - |
| Surplus/(Deficit) after capital transfers & contributions | 1 410 | 17 306 | 19 007 | (10 260) | (28 916) |
| Share of surplus/(deficit) of associate | - | - | - | - | - |
| Surplus/(Deficit) for the year | 1 410 | 17 306 | 19 007 | (10 260) | (28 916) |
| CAPITAL EXPENDITURE & FUNDS SOURCES | |||||
| Capital expenditure | 29 507 | 16 889 | 50 741 | 27 823 | (0) |
| Transfers recognised - capital | 24 155 | 13 869 | 48 416 | 26 112 | 7 327 |
| Borrowing | - | - | - | - | - |
| Internally generated funds | 5 353 | 1 190 | 1 912 | 1 710 | (7 327) |
| Total sources of capital funds | 29 507 | 15 059 | 50 327 | 27 823 | (0) |
| FINANCIAL POSITION | |||||
| Total current assets | 77 382 | 132 085 | 153 267 | 174 604 | 100 796 |
| Total non current assets | 468 655 | 452 716 | 465 256 | 436 672 | 541 489 |
| Total current liabilities | 128 765 | 178 040 | 218 201 | 231 716 | 159 221 |
| Total non current liabilities | 102 325 | 81 256 | 50 605 | 50 537 | 46 939 |
| Community wealth/Equity | 313 537 | 308 199 | 330 710 | 339 284 | 465 041 |
| CASH FLOWS | |||||
| Net cash from (used) operating | (12 964) | (438 419) | 3 028 178 | 3 116 869 | 1 926 959 |
| Net cash from (used) investing | (10 995) | 5 992 | (50 350) | (17 560) | (19 948) |
| Net cash from (used) financing | (1 181) | (1 182) | (759) | (613) | - |
| Cash/cash equivalents at the year end | (6 971) | (418 337) | 2 992 820 | 3 119 913 | 1 924 612 |
| UNAUTHORISED, IRREGULAR, FRUITLESS & WASTEFUL EXPENDITURE | |||||
| Unauthorised expenditure | n/a | 12 677 | 21 279 | 146 586 | 103 899 |
| Irregular expenditure | n/a | 20 689 | 27 781 | 8 301 | 23 273 |
| Fruitless & wasteful expenditure | n/a | 1 213 | 8 962 | 10 174 | 3 |
| SOURCE | Audited Outcome A1 2026 Q1 | Audited Outcome A1 2026 Q1 | Audited Outcome A1 2026 Q1 | Audited Outcome A1 2024 | Audited Outcome A1 2023 |
Employment Statistics
| 2022/23 | 2021/22 | 2020/21 | 2019/20 | 2018/19 | |
| Employment | |||||
| Employment Costs (R’000) | 125 625 | 124 977 | 122 961 | 116 205 | 106 439 |
| Remuneration of councillors (R’000) | 6 266 | 6 173 | 6 228 | 6 286 | 608 |
| Total Employee Positions | 465 | 532 | 511 | 511 | 481 |
| Total Vacant Employee Positions | 8 | 73 | 4 | 4 | 138 |
| Total Vacancy Percentage | 1.72% | 13.72% | 0.78% | 0.78% | 28.69% |
| Managerial Positions – S54A and S56 | 6 | 6 | 6 | 6 | 6 |
| Vacant Managerial Positions – S54A and S56 | 5 | 5 | 1 | 1 | 2 |
| Managerial Positions - by organogram | 17 | 17 | 17 | 17 | 16 |
| Vacant Managerial Positions - by organogram | 3 | 1 | 3 | 3 | 6 |
Service Delivery Statistics
| 2022/23 | 2021/22 | 2020/21 | 2019/20 | 2018/19 | |
| Water | |||||
| Does the municipality provide? | Yes | Yes | Yes | Yes | Yes |
| Number of households and non-domestic customers to which provided | 15 934 | 15 934 | 15 934 | 15 934 | 15 934 |
| Number of domestic households/delivery points | 14 961 | 14 961 | 14 961 | 14 961 | 14 961 |
| Inside the yard | 14 621 | 14 621 | 14 621 | 14 621 | 14 621 |
| Less than 200m from yard | 80 | 80 | 80 | 80 | 80 |
| More than 200m from yard | 260 | 260 | 260 | 260 | 260 |
| Domestic households with access to free basic service | 4 593 | 4 571 | 6 627 | 6 529 | 4 776 |
| Electricity | |||||
| Does the municipality provide? | Yes | Yes | Yes | Yes | Yes |
| Number of households and non-domestic customers to which provided | 14 165 | 13 813 | 13 697 | 13 697 | 13 448 |
| Domestic households with access to free basic service | 4 593 | 4 571 | 6 607 | 6 549 | 6 505 |
| Sewerage and Sanitation | |||||
| Does the municipality provide? | Yes | Yes | Yes | Yes | Yes |
| Number of households and non-domestic customers to which provided | 15 310 | 15 310 | 15 310 | 15 310 | 14 951 |
| Number of households using: | |||||
| Flush toilet - public sewerage | 12 383 | 12 383 | 12 383 | 12 383 | 12 055 |
| Flush toilet - septic tank | 1 568 | 1 568 | 1 568 | 1 568 | 1 568 |
| Ventilated pit latrine | 355 | 355 | 355 | 355 | 355 |
| Bucket system | 0 | 0 | 0 | 0 | 0 |
| Other | 31 | 31 | 31 | 31 | 0 |
| Domestic households with access to free basic service | 4 593 | 4 571 | 4 889 | 4 800 | 4 638 |
| Solid Waste Services | |||||
| Does the municipality provide? | Yes | Yes | Yes | Yes | Yes |
| Number of households and non-domestic customers to which provided | 12 978 | 12 978 | 12 978 | 12 978 | 12 182 |
| Domestic households with access to free basic service | 4 593 | 5 471 | 2 589 | 2 539 | 2 236 |