 A
A
Municipalities
Amathole District Municipality (DC12)
Metropolitan, district, and local municipalities across South Africa.
Overview
Amathole District Municipality (DC12) is a district authority that supports regional planning and service delivery coordination across its constituent local municipalities. It contributes to integrated development planning, infrastructure coordination, and programmes that benefit from district-level scale and shared capacity. This profile summarises the municipality’s governance context and provides a public reference point for key details.
Geography, History & Economy
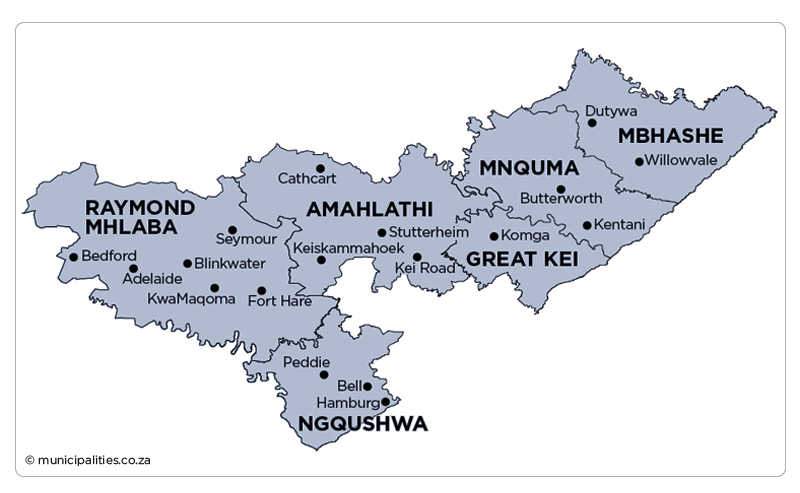
Amathole District Municipality comprises:
- Amahlathi Local Municipality
- Great Kei Local Municipality
- Mbhashe Local Municipality
- Mnquma Local Municipality
- Ngqushwa Local Municipality
- Raymond Mhlaba Local Municipality
MDB code: DC12
Description: The Amathole District Municipality is a Category C municipality situated in the central part of the Eastern Cape. It stretches along the Sunshine Coast from the Fish River Mouth and along the Eastern Seaboard to just south of Hole in the Wall along the Wild Coast. It is bordered to the north by the Amathole Mountain Range. The municipality is comprised of six local municipalities: Mbhashe, Mnquma, Great Kei, Amahlathi, Ngqushwa and Raymond Mhlaba. Four heritage routes have been developed that are named after Xhosa kings and heroes. They are the Maqoma Route, the Makana Route, the Sandile Route and the Phalo Route. These intertwine with the other tourism routes located within the district, namely the Sunshine Coast Route, the Wild Coast Route, the Amathole Mountain Escape Route and the Friendly N6 Route.
Area: 21 114km²
Cities/Towns: Adelaide, Alice, Amatola Coastal, Bedford, Butterworth, Cathcart, Dutywa, Elliotdale, Hamburg, Hogsback, Kei Mouth, Kei Road, Keiskammahoek, Kentani, Komga, KwaMaqoma (Fort Beaufort), Middeldrift, Morgan Bay, Ngqamakhwe, Peddie, Seymore, Stutterheim, Tshoxa, Willowvale
Main Economic Sectors: Agriculture, tourism and heritage, rural development, poverty alleviation, enterprise development, environmental management, mining - Source IDP 2023/24
Map
Council & Management
Demographic Information
| 2022 | 2016 | 2011 | |
| Population | 871 601 | 880 790 | 854 967 |
| Age Structure | |||
| Population under 15 | 29.3% | 32.7% | 33.5% |
| Population 15 to 64 | 60.4% | 61.6% | 57.6% |
| Population over 65 | 10.4% | 5.7% | 8.9% |
| Dependency Ratio | |||
| Per 100 (15-64) | 65.7 | 62.4 | 73.6 |
| Sex Ratio | |||
| Males per 100 females | 90.9 | 89.6 | 88.5 |
| Population Growth | |||
| Per annum | 0.19% | 0.65% | n/a |
| Labour Market | |||
| Unemployment rate (official) | n/a | n/a | n/a |
| Youth unemployment rate (official) 15-34 | n/a | n/a | n/a |
| Education (aged 20 +) | |||
| No schooling | 9.2% | 10.2% | 13.6% |
| Matric | n/a | 19.0% | 13.2% |
| Higher education | 7.2% | 5.7% | 6.1% |
| Household Dynamics | |||
| Households | 241 612 | 213 763 | 227 572 |
| Average household size | 3.6 | 4.1 | 3.8 |
| Female headed households | n/a | 52.2% | 53.0% |
| Formal dwellings | 81.1% | 55.9% | 52.7% |
| Housing owned | n/a | 71.2% | 67.8% |
| Household Services | |||
| Flush toilet connected to sewerage | 40.1% | 17.0% | 18.1% |
| Weekly refuse removal | 35.4% | 17.4% | 16.5% |
| Piped water inside dwelling | 34.6% | 12.3% | 12.6% |
| Electricity for lighting | 94.5% | 82.4% | 69.8% |
Financial Results
| All values: R'000 | 2024/25 | 2023/24 | 2022/23 | 2021/22 | 2020/21 |
| AUDIT OUTCOME | n/a | Qualified audit | Disclaimer of audit | Disclaimer of audit | Adverse audit |
| FINANCIAL PERFORMANCE | |||||
| Property rates | - | - | - | - | - |
| Service charges | 691 561 | (113 992) | 483 170 | 525 698 | 416 669 |
| Investment revenue | 37 834 | 8 440 | 24 834 | 12 795 | 9 447 |
| Transfers recognised - operational | 664 242 | (104 685) | 997 918 | 730 617 | 973 614 |
| Other own revenue | 664 648 | 10 569 | 69 144 | 504 130 | 120 908 |
| Total Revenue (excluding capital transfers and contributions) | 2 058 285 | (199 669) | 1 575 066 | 1 773 240 | 1 520 638 |
| Employee costs | 659 034 | 25 084 | 659 221 | 679 639 | 726 734 |
| Remuneration of councillors | 17 401 | 2 976 | 14 367 | 14 716 | 16 234 |
| Depreciation and amortisation | 282 773 | 260 327 | 8 064 | 95 396 | 180 485 |
| Finance charges | 36 340 | 21 046 | 21 837 | 15 721 | 7 400 |
| Inventory consumed and bulk purchases | 444 238 | 166 108 | 42 809 | 59 778 | (174 896) |
| Transfers and subsidies | 15 498 | 145 | 10 000 | 9 946 | 15 600 |
| Other expenditure | 722 446 | 320 328 | 677 904 | 769 192 | 1 073 813 |
| Total Expenditure | 2 177 731 | 796 015 | 1 434 201 | 1 644 388 | 1 845 369 |
| Surplus/(Deficit) | (119 446) | (995 684) | 140 864 | 128 852 | (324 731) |
| Transfers and subsidies - capital (monetary allocations) | 651 278 | 154 928 | 189 283 | 332 765 | 492 618 |
| Transfers and subsidies - capital (in-kind) | - | - | - | - | - |
| Surplus/(Deficit) after capital transfers & contributions | 531 831 | (840 756) | 330 147 | 461 617 | 167 887 |
| Share of surplus/(deficit) of associate | - | - | - | - | - |
| Surplus/(Deficit) for the year | 531 831 | (840 756) | 330 147 | 461 617 | 167 887 |
| CAPITAL EXPENDITURE & FUNDS SOURCES | |||||
| Capital expenditure | 381 432 | 11 028 900 | 180 465 | 245 141 | 224 476 |
| Transfers recognised - capital | 353 325 | (3 972 028) | 121 064 | 252 764 | (153 024) |
| Borrowing | - | - | - | - | - |
| Internally generated funds | - | - | - | - | - |
| Total sources of capital funds | 353 325 | (3 972 028) | 121 064 | 252 764 | (153 024) |
| FINANCIAL POSITION | |||||
| Total current assets | 1 504 299 | 304 960 | 884 499 | 820 799 | 765 809 |
| Total non current assets | 10 292 899 | 9 901 921 | 5 207 864 | 4 516 379 | 4 597 400 |
| Total current liabilities | 1 122 239 | 1 163 933 | 1 105 865 | 4 728 431 | 902 777 |
| Total non current liabilities | 200 923 | 201 094 | 181 530 | 144 554 | 176 923 |
| Community wealth/Equity | 9 942 205 | 9 682 611 | 4 474 821 | 2 577 | 4 115 622 |
| CASH FLOWS | |||||
| Net cash from (used) operating | 5 044 124 | 267 169 | 1 477 360 | 344 903 | 356 055 |
| Net cash from (used) investing | - | - | - | - | 0 |
| Net cash from (used) financing | - | - | - | - | (136) |
| Cash/cash equivalents at the year end | 5 271 785 | 663 441 | 1 703 239 | 435 734 | 550 089 |
| UNAUTHORISED, IRREGULAR, FRUITLESS & WASTEFUL EXPENDITURE | |||||
| Unauthorised expenditure | n/a | 188 649 | 36 796 | 69 438 | - |
| Irregular expenditure | n/a | 639 289 | 223 054 | 46 749 | 39 233 |
| Fruitless & wasteful expenditure | n/a | 28 182 | 21 699 | 61 394 | 6 960 |
| SOURCE | Audited Outcome A1 2026 Q1 | Audited Outcome A1 2026 Q1 | Audited Outcome A1 2026 Q1 | Audited Outcome A1 2024 | Audited Outcome A1 2023 |
Employment Statistics
| 2022/23 | 2021/22 | 2020/21 | 2019/20 | 2018/19 | |
| Employment | |||||
| Employment Costs (R’000) | 659 221 | 679 639 | 726 734 | 734 907 | 628 296 |
| Remuneration of councillors (R’000) | 14 367 | 14 716 | 16 234 | 15 015 | 15 242 |
| Total Employee Positions | 2 298 | 1 536 | 3 107 | 2 299 | 1 605 |
| Total Vacant Employee Positions | 916 | 123 | 876 | 781 | 344 |
| Total Vacancy Percentage | 39.86% | 8.01% | 28.19% | 33.97% | 21.43% |
| Managerial Positions – S54A and S56 | 7 | 7 | 8 | 8 | 7 |
| Vacant Managerial Positions – S54A and S56 | 3 | 2 | 2 | 1 | 2 |
| Managerial Positions - by organogram | 226 | 226 | 237 | 237 | 156 |
| Vacant Managerial Positions - by organogram | 104 | 121 | 89 | 89 | 20 |
Service Delivery Statistics
| 2022/23 | 2021/22 | 2020/21 | 2019/20 | 2018/19 | |
| Water | |||||
| Does the municipality provide? | Yes | Yes | Yes | Yes | Yes |
| Number of households and non-domestic customers to which provided | 282 322 | 282 322 | 327 463 | 245 003 | 245 003 |
| Number of domestic households/delivery points | 281 486 | 281 486 | 326 627 | 244 167 | 244 167 |
| Inside the yard | 56 289 | 56 289 | 54 305 | 36 069 | 36 069 |
| Less than 200m from yard | 184 646 | 184 646 | 184 646 | 202 100 | 202 100 |
| More than 200m from yard | 40 551 | 40 551 | 87 676 | 5 998 | 5 998 |
| Domestic households with access to free basic service | 1 597 | 1 613 | 1 613 | 1 613 | 34 617 |
| Electricity | |||||
| Does the municipality provide? | No | No | No | No | No |
| Number of households and non-domestic customers to which provided | 0 | 0 | 0 | 0 | 0 |
| Domestic households with access to free basic service | 0 | 0 | 0 | 0 | 0 |
| Sewerage and Sanitation | |||||
| Does the municipality provide? | Yes | Yes | Yes | Yes | Yes |
| Number of households and non-domestic customers to which provided | 311 181 | 308 707 | 229 689 | 229 689 | 192 516 |
| Number of households using: | |||||
| Flush toilet - public sewerage | 42 762 | 42 762 | 23 882 | 23 882 | 23 882 |
| Flush toilet - septic tank | 0 | 0 | 0 | 0 | 0 |
| Ventilated pit latrine | 267 583 | 265 109 | 204 971 | 204 971 | 167 699 |
| Bucket system | 0 | 0 | 0 | 0 | 0 |
| Other | 0 | 0 | 0 | 0 | 0 |
| Domestic households with access to free basic service | 1 597 | 1 613 | 1 613 | 1 613 | 34 617 |
| Solid Waste Services | |||||
| Does the municipality provide? | No | No | No | No | No |
| Number of households and non-domestic customers to which provided | 0 | 0 | 0 | 0 | 0 |
| Domestic households with access to free basic service | 0 | 0 | 0 | 0 | 0 |