 B
B
Municipalities
Big 5 Hlabisa Local Municipality (KZN276)
Metropolitan, district, and local municipalities across South Africa.
Overview
Big 5 Hlabisa Local Municipality (KZN276) provides local government services and manages development priorities within its municipal area. It is responsible for municipal administration, service delivery coordination, and planning functions that support infrastructure and community wellbeing. This page consolidates key public reference details for stakeholders.
Geography, History & Economy
Big 5 Hlabisa Local Municipality is part of uMkhanyakude District Municipality .
MDB code: KZN276
Description: The Big 5 Hlabisa Local Municipality is a Category B municipality situated within the uMkhanyakude District in northern KwaZulu-Natal. It is one of four municipalities in the district, making up a quarter of its geographical area. It was established by the amalgamation of The Big 5 False Bay and Hlabisa Local Municipalities in August 2016. Easily accessible off the N2 National Route, it incorporates part of the iSimangaliso Wetland Park (previously known as the Greater St Lucia Wetlands Park) and is the starting point of the MR4 (LSDI Corridor), which links Hluhluwe to Mozambique. The town of Hluhluwe, which contains major shopping and light servicing facilities, as well as the municipal offices, services the municipality. A large proportion of the land is used for agriculture and game lodge activities and is sparsely settled. The north-eastern parts of the municipality are occupied by fairly densely settled rural traditional communities (Makhasa, Mnqobokasi and Nibela). A major drawcard is the tourism industry centred on the Hluhluwe-uMfolozi Game Reserve, located 280km north of Durban and the oldest proclaimed park in Africa. It consists of 960km² of hilly topography in central Zululand, KwaZulu-Natal, and is known for its rich wildlife and conservation efforts. The park is the only state-run park in KwaZulu-Natal where all the Big Five game occur. Due to conservation efforts, the park now has the largest population of white rhino in the world.
Area: 3 470km²
Cities/Towns: Hlabisa, Hluhluwe
Main Economic Sectors: Agriculture (12.7%), mining (1.4%), manufacturing (8%), electricity (6%), construction (3.9%), trade (13.2%), transport (8.4%), finance (15.8%), community services (30.6%). As contribution to GVA - Source IDP 2024/25
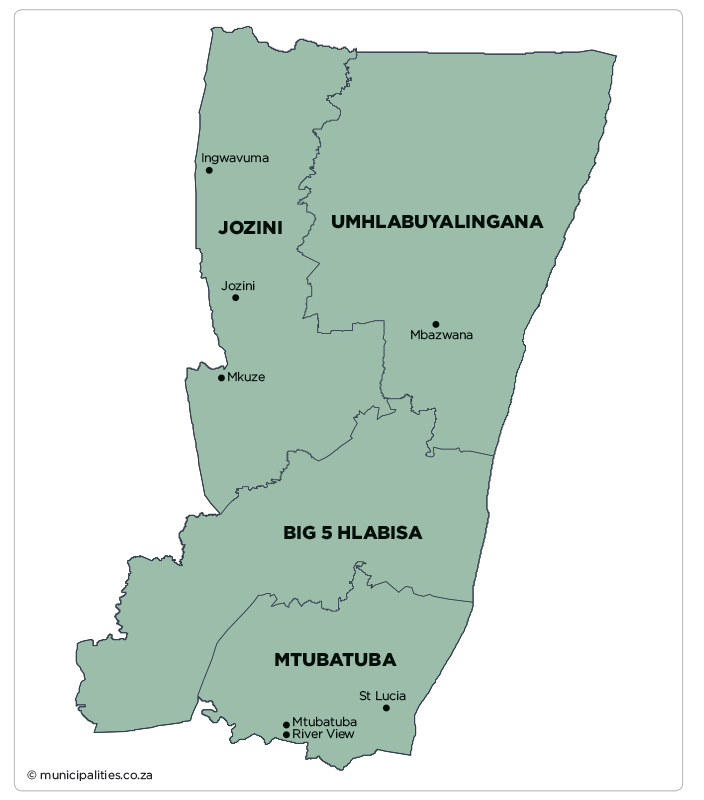
Map
Council & Management
Demographic Information
| 2022 | 2016 | 2011 | |
| Population | 131 755 | 116 622 | 107 147 |
| Age Structure | |||
| Population under 15 | 34.9% | 40.3% | 40.1% |
| Population 15 to 64 | 59.8% | 55.6% | 55.2% |
| Population over 65 | 5.3% | 4.2% | 4.7% |
| Dependency Ratio | |||
| Per 100 (15-64) | 67.2 | 79.9 | 81.1 |
| Sex Ratio | |||
| Males per 100 females | 86.2 | 88.2 | 85.6 |
| Population Growth | |||
| Per annum | 2.01% | 1.93% | n/a |
| Labour Market | |||
| Unemployment rate (official) | n/a | n/a | n/a |
| Youth unemployment rate (official) 15-34 | n/a | n/a | n/a |
| Education (aged 20 +) | |||
| No schooling | 16.3% | 14.7% | 23.3% |
| Matric | n/a | 31.2% | 25.4% |
| Higher education | 5.1% | 7.1% | 3.7% |
| Household Dynamics | |||
| Households | 23 136 | 25 255 | 20 567 |
| Average household size | 5.7 | 4.6 | 5.2 |
| Female headed households | n/a | 55.5% | 56.2% |
| Formal dwellings | 91.6% | 70.2% | 71.1% |
| Housing owned | n/a | 85.6% | 36.7% |
| Household Services | |||
| Flush toilet connected to sewerage | 20.3% | 9.5% | 16.0% |
| Weekly refuse removal | 17.3% | 1.6% | 10.4% |
| Piped water inside dwelling | 20.0% | 11.0% | 16.7% |
| Electricity for lighting | 95.1% | 70.1% | 50.4% |
Financial Results
| All values: R'000 | 2024/25 | 2023/24 | 2022/23 | 2021/22 | 2020/21 |
| AUDIT OUTCOME | n/a | Financially unqualified | Financially unqualified | Financially unqualified | Financially unqualified |
| FINANCIAL PERFORMANCE | |||||
| Property rates | 29 094 | 27 401 | 24 694 | 25 319 | 27 516 |
| Service charges | 2 275 | 2 179 | 2 126 | 2 158 | 2 328 |
| Investment revenue | 9 974 | 9 647 | 6 161 | 2 769 | 1 575 |
| Transfers recognised - operational | 164 658 | 156 899 | 146 819 | 152 637 | 193 106 |
| Other own revenue | 10 657 | 5 565 | 9 064 | 3 080 | 4 590 |
| Total Revenue (excluding capital transfers and contributions) | 216 659 | 201 690 | 188 863 | 185 963 | 229 115 |
| Employee costs | 90 250 | 86 281 | 84 908 | 83 198 | 80 759 |
| Remuneration of councillors | 11 348 | 10 467 | 9 108 | 8 328 | 7 262 |
| Depreciation and amortisation | 18 206 | 17 259 | 18 062 | 19 114 | 28 686 |
| Finance charges | 1 641 | 1 477 | 1 213 | 917 | 752 |
| Inventory consumed and bulk purchases | - | - | - | - | - |
| Transfers and subsidies | 4 850 | 3 259 | 2 033 | 1 498 | 2 353 |
| Other expenditure | 95 539 | 87 650 | 73 168 | 83 119 | 95 019 |
| Total Expenditure | 221 835 | 206 393 | 188 492 | 196 173 | 214 832 |
| Surplus/(Deficit) | (5 175) | (4 703) | 371 | (10 210) | 14 283 |
| Transfers and subsidies - capital (monetary allocations) | 24 436 | 30 668 | 28 568 | 39 895 | 27 800 |
| Transfers and subsidies - capital (in-kind) | - | 532 | 156 | - | 111 |
| Surplus/(Deficit) after capital transfers & contributions | 19 261 | 26 497 | 29 095 | 29 685 | 42 195 |
| Share of surplus/(deficit) of associate | - | - | - | - | - |
| Surplus/(Deficit) for the year | 19 261 | 26 497 | 29 095 | 29 685 | 42 195 |
| CAPITAL EXPENDITURE & FUNDS SOURCES | |||||
| Capital expenditure | 485 023 | 457 295 | 405 197 | 381 878 | 346 869 |
| Transfers recognised - capital | 71 748 | 77 913 | 68 512 | 65 293 | 53 163 |
| Borrowing | - | - | - | - | - |
| Internally generated funds | 299 266 | 282 118 | 240 153 | 224 573 | 211 491 |
| Total sources of capital funds | 371 014 | 360 031 | 308 665 | 289 865 | 264 654 |
| FINANCIAL POSITION | |||||
| Total current assets | 132 444 | 121 119 | 112 045 | 94 637 | 90 150 |
| Total non current assets | 280 065 | 267 487 | 248 790 | 241 732 | 277 750 |
| Total current liabilities | 30 188 | 28 582 | 29 361 | 34 343 | 38 973 |
| Total non current liabilities | 16 781 | 13 745 | 11 700 | 10 963 | 6 517 |
| Community wealth/Equity | 346 279 | 319 781 | 290 679 | 261 378 | 280 215 |
| CASH FLOWS | |||||
| Net cash from (used) operating | (22 784) | 18 226 | 1 277 | 93 465 | 26 450 |
| Net cash from (used) investing | 1 556 | 20 983 | 20 107 | 19 643 | 1 500 |
| Net cash from (used) financing | - | - | - | 10 | 44 |
| Cash/cash equivalents at the year end | 47 129 | 120 252 | 86 115 | 163 475 | 27 994 |
| UNAUTHORISED, IRREGULAR, FRUITLESS & WASTEFUL EXPENDITURE | |||||
| Unauthorised expenditure | n/a | 2 649 | 1 250 | 230 033 | 44 749 |
| Irregular expenditure | n/a | 1 016 | 7 024 | 7 264 | 8 837 |
| Fruitless & wasteful expenditure | n/a | 1 | 0 | 3 716 | 318 |
| SOURCE | Audited Outcome A1 2026 Q1 | Audited Outcome A1 2026 Q1 | Audited Outcome A1 2026 Q1 | Audited Outcome A1 2024 | Audited Outcome A1 2023 |
Employment Statistics
| 2022/23 | 2021/22 | 2020/21 | 2019/20 | 2018/19 | |
| Employment | |||||
| Employment Costs (R’000) | 84 908 | 83 198 | 80 759 | 79 090 | 73 414 |
| Remuneration of councillors (R’000) | 9 108 | 8 328 | 7 262 | 7 212 | 7 420 |
| Total Employee Positions | 238 | 254 | 252 | 242 | 253 |
| Total Vacant Employee Positions | 22 | 11 | 1 | 0 | 0 |
| Total Vacancy Percentage | 9.24% | 4.33% | 0.40% | 0.00% | 0.00% |
| Managerial Positions – S54A and S56 | 5 | 5 | 5 | 5 | 5 |
| Vacant Managerial Positions – S54A and S56 | 0 | 1 | 1 | 0 | 0 |
| Managerial Positions - by organogram | 20 | 20 | 20 | 20 | 20 |
| Vacant Managerial Positions - by organogram | 10 | 8 | 0 | 0 | 0 |
Service Delivery Statistics
| 2022/23 | 2021/22 | 2020/21 | 2019/20 | 2018/19 | |
| Water | |||||
| Does the municipality provide? | No | No | No | No | No |
| Number of households and non-domestic customers to which provided | 0 | 0 | 0 | 0 | 0 |
| Number of domestic households/delivery points | 0 | 0 | 0 | 0 | 0 |
| Inside the yard | 0 | 0 | 0 | 0 | 0 |
| Less than 200m from yard | 0 | 0 | 0 | 0 | 0 |
| More than 200m from yard | 0 | 0 | 0 | 0 | 0 |
| Domestic households with access to free basic service | 0 | 0 | 0 | 0 | 0 |
| Electricity | |||||
| Does the municipality provide? | No | No | No | No | No |
| Number of households and non-domestic customers to which provided | 15 528 | 15 528 | 15 054 | 14 653 | 13 621 |
| Domestic households with access to free basic service | 663 | 474 | 401 | 162 | 700 |
| Sewerage and Sanitation | |||||
| Does the municipality provide? | No | No | No | No | No |
| Number of households and non-domestic customers to which provided | 0 | 0 | 0 | 0 | 0 |
| Number of households using: | |||||
| Flush toilet - public sewerage | 0 | 0 | 0 | 0 | 0 |
| Flush toilet - septic tank | 0 | 0 | 0 | 0 | 0 |
| Ventilated pit latrine | 0 | 0 | 0 | 0 | 0 |
| Bucket system | 0 | 0 | 0 | 0 | 0 |
| Other | 0 | 0 | 0 | 0 | 0 |
| Domestic households with access to free basic service | 0 | 0 | 0 | 0 | 0 |
| Solid Waste Services | |||||
| Does the municipality provide? | Yes | Yes | Yes | Yes | Yes |
| Number of households and non-domestic customers to which provided | 1 060 | 1 060 | 1 060 | 1 060 | 1 060 |
| Domestic households with access to free basic service | 0 | 0 | 0 | 0 | 0 |