 B
B
Municipalities
Blouberg Local Municipality (LIM351)
Metropolitan, district, and local municipalities across South Africa.
Overview
Blouberg Local Municipality (LIM351) is responsible for municipal governance and service delivery within its municipal area. It manages local planning, service coordination, and administrative functions that shape infrastructure and community outcomes. This profile consolidates public reference details to support understanding of the municipality’s role.
Geography, History & Economy
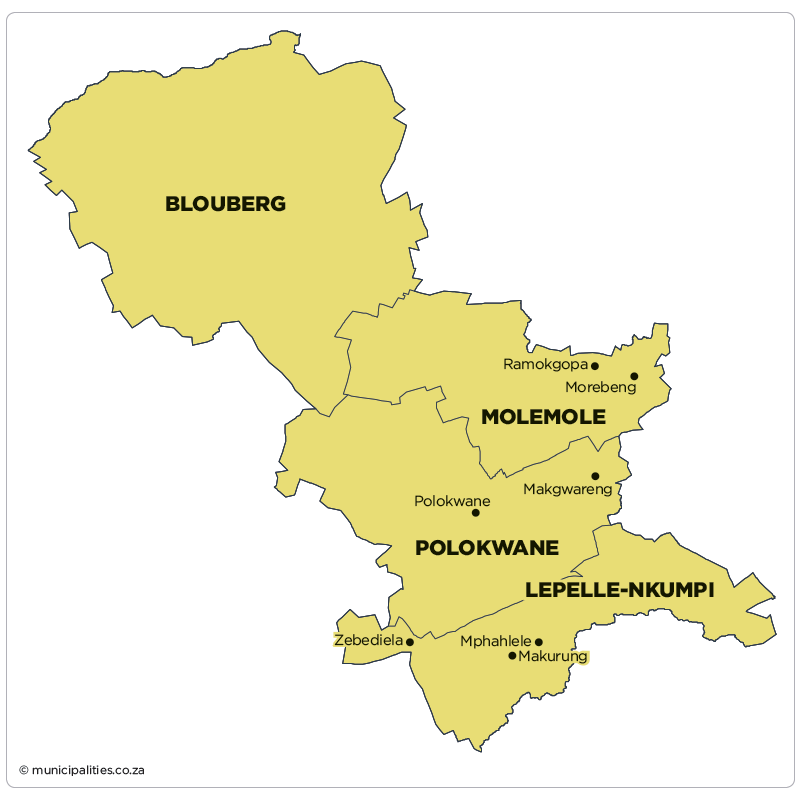
Blouberg Local Municipality is part of Capricorn District Municipality .
MDB code: LIM351
Description: The Blouberg Local Municipality is a Category B municipality situated within the Capricorn District of the Limpopo Province, in the northern part of South Africa, bordering Zimbabwe and Botswana. It is the largest of four municipalities in the district, making up almost half of its geographical area. Blouberg is home to some of the most spectacular rock climbing in South Africa. It is famous for its big-wall natural climbing, with route lengths up to 350m. The vegetation ranges from subtropical savanna at the base, to alpine near the summit. It takes its name from the Blouberg (blue mountains), a mountain range located to the west of the western end of the Soutpansberg Mountain Range, north-west of the town of Vivo. Blouberg is a hot area with annual rainfall varying between 380 and 550mm. Most rainfall is experienced during the summer months. Evapotranspiration during the rainy season is very high. The area is prone to frequent drought, which has an adverse effect on the local economy. The only perennial river is the Mogalakwena River, which feeds the Glen Alpine Dam, the only source of pipeline water in the area.
Area: 9 540km²
Cities/Towns: Alldays, Senwabarwana (Bochum)
Main Economic Sectors: Agriculture, mining, tourism
Open Tenders
View all →Map
Council & Management
Demographic Information
| 2022 | 2016 | 2011 | |
| Population | 192 109 | 172 601 | 175 085 |
| Age Structure | |||
| Population under 15 | 35.0% | 40.0% | 38.9% |
| Population 15 to 64 | 56.5% | 53.0% | 53.5% |
| Population over 65 | 8.5% | 7.0% | 7.6% |
| Dependency Ratio | |||
| Per 100 (15-64) | 77.0 | 88.5 | 87.0 |
| Sex Ratio | |||
| Males per 100 females | 84.4 | 82.1 | 83.5 |
| Population Growth | |||
| Per annum | 0.90% | -0.32% | n/a |
| Labour Market | |||
| Unemployment rate (official) | n/a | n/a | n/a |
| Youth unemployment rate (official) 15-34 | n/a | n/a | n/a |
| Education (aged 20 +) | |||
| No schooling | 20.4% | 19.5% | 27.4% |
| Matric | n/a | 18.9% | 15.7% |
| Higher education | 5.6% | 6.0% | 5.0% |
| Household Dynamics | |||
| Households | 57 575 | 43 747 | 44 673 |
| Average household size | 3.3 | 3.9 | 3.9 |
| Female headed households | n/a | 57.3% | 56.3% |
| Formal dwellings | 96.5% | 95.6% | 93.3% |
| Housing owned | n/a | 65.4% | 57.2% |
| Household Services | |||
| Flush toilet connected to sewerage | 30.9% | 5.5% | 7.0% |
| Weekly refuse removal | 33.3% | 16.6% | 19.3% |
| Piped water inside dwelling | 32.7% | 1.4% | 7.8% |
| Electricity for lighting | 97.7% | 95.2% | 88.0% |
Financial Results
| All values: R'000 | 2024/25 | 2023/24 | 2022/23 | 2021/22 | 2020/21 |
| AUDIT OUTCOME | n/a | Qualified audit | Qualified audit | Financially unqualified | Financially unqualified |
| FINANCIAL PERFORMANCE | |||||
| Property rates | 73 176 | 68 961 | 25 229 | 29 497 | 27 550 |
| Service charges | 44 100 | 37 519 | 33 877 | 31 039 | 30 264 |
| Investment revenue | 7 421 | 7 844 | 4 112 | 2 019 | 1 536 |
| Transfers recognised - operational | 251 677 | 241 376 | 225 391 | 214 163 | 239 283 |
| Other own revenue | 18 411 | 18 027 | 31 523 | 12 851 | 7 332 |
| Total Revenue (excluding capital transfers and contributions) | 394 785 | 373 726 | 320 133 | 289 569 | 305 964 |
| Employee costs | 146 080 | 132 265 | 124 044 | 119 858 | 115 511 |
| Remuneration of councillors | 19 780 | 19 213 | 17 982 | 17 214 | 16 412 |
| Depreciation and amortisation | 69 751 | 65 893 | 35 158 | 30 421 | 29 419 |
| Finance charges | 4 343 | 4 442 | - | - | - |
| Inventory consumed and bulk purchases | 76 197 | 65 679 | 54 659 | 52 721 | 38 802 |
| Transfers and subsidies | - | - | - | 50 | - |
| Other expenditure | 150 944 | 89 439 | 182 037 | 103 731 | 108 577 |
| Total Expenditure | 467 096 | 376 930 | 413 880 | 323 995 | 308 722 |
| Surplus/(Deficit) | (72 310) | (3 203) | (93 748) | (34 426) | (2 757) |
| Transfers and subsidies - capital (monetary allocations) | 114 213 | 95 457 | 112 528 | 62 602 | 55 896 |
| Transfers and subsidies - capital (in-kind) | - | - | - | - | - |
| Surplus/(Deficit) after capital transfers & contributions | 41 903 | 92 253 | 18 780 | 28 176 | 53 139 |
| Share of surplus/(deficit) of associate | - | - | - | - | - |
| Surplus/(Deficit) for the year | 41 903 | 92 253 | 18 780 | 28 176 | 53 139 |
| CAPITAL EXPENDITURE & FUNDS SOURCES | |||||
| Capital expenditure | 105 978 | 84 579 | 524 | 8 074 | 5 444 |
| Transfers recognised - capital | 99 962 | 83 484 | - | - | 26 |
| Borrowing | - | - | - | - | - |
| Internally generated funds | 6 017 | 1 094 | 524 | 8 074 | 5 418 |
| Total sources of capital funds | 105 978 | 84 579 | 524 | 8 074 | 5 444 |
| FINANCIAL POSITION | |||||
| Total current assets | 232 540 | 286 071 | 157 302 | 189 118 | 161 275 |
| Total non current assets | 1 539 334 | 1 499 415 | 1 076 476 | 986 552 | 951 986 |
| Total current liabilities | 144 620 | 200 841 | 113 649 | 89 480 | 58 691 |
| Total non current liabilities | 20 335 | 19 629 | 40 779 | 26 570 | 23 126 |
| Community wealth/Equity | 1 727 039 | 1 569 349 | 1 025 116 | 1 074 662 | 1 025 015 |
| CASH FLOWS | |||||
| Net cash from (used) operating | (139 624) | 119 778 | (131 677) | (52 470) | 115 994 |
| Net cash from (used) investing | (102 693) | (89 554) | (750) | (8 074) | (2 871) |
| Net cash from (used) financing | (1 179) | 6 538 | - | - | - |
| Cash/cash equivalents at the year end | (57 096) | 138 605 | (47 593) | (19 214) | 154 630 |
| UNAUTHORISED, IRREGULAR, FRUITLESS & WASTEFUL EXPENDITURE | |||||
| Unauthorised expenditure | n/a | - | - | 7 087 | - |
| Irregular expenditure | n/a | 34 654 | 4 702 | 8 338 | 30 286 |
| Fruitless & wasteful expenditure | n/a | - | - | - | - |
| SOURCE | Audited Outcome A1 2026 Q1 | Audited Outcome A1 2026 Q1 | Audited Outcome A1 2026 Q1 | Audited Outcome A1 2024 | Audited Outcome A1 2023 |
Employment Statistics
| 2022/23 | 2021/22 | 2020/21 | 2019/20 | 2018/19 | |
| Employment | |||||
| Employment Costs (R’000) | 124 044 | 119 858 | 115 511 | 110 376 | 103 613 |
| Remuneration of councillors (R’000) | 17 982 | 17 214 | 16 412 | 16 976 | 16 187 |
| Total Employee Positions | 321 | 230 | 195 | 198 | 268 |
| Total Vacant Employee Positions | 96 | 14 | 7 | 6 | 57 |
| Total Vacancy Percentage | 29.91% | 6.09% | 3.59% | 3.03% | 21.27% |
| Managerial Positions – S54A and S56 | 6 | 6 | 6 | 6 | 6 |
| Vacant Managerial Positions – S54A and S56 | 4 | 2 | 0 | 0 | 1 |
| Managerial Positions - by organogram | 33 | 33 | 32 | 32 | 25 |
| Vacant Managerial Positions - by organogram | 4 | 6 | 7 | 6 | 0 |
Service Delivery Statistics
| 2022/23 | 2021/22 | 2020/21 | 2019/20 | 2018/19 | |
| Water | |||||
| Does the municipality provide? | No | No | No | No | No |
| Number of households and non-domestic customers to which provided | 0 | 0 | 0 | 0 | 0 |
| Number of domestic households/delivery points | 0 | 0 | 0 | 0 | 0 |
| Inside the yard | 0 | 0 | 0 | 0 | 0 |
| Less than 200m from yard | 0 | 0 | 0 | 0 | 0 |
| More than 200m from yard | 0 | 0 | 0 | 0 | 0 |
| Domestic households with access to free basic service | 0 | 0 | 0 | 0 | 0 |
| Electricity | |||||
| Does the municipality provide? | Yes | Yes | Yes | Yes | Yes |
| Number of households and non-domestic customers to which provided | 43 423 | 43 344 | 43 010 | 43 010 | 43 010 |
| Domestic households with access to free basic service | 129 | 129 | 4 834 | 4 834 | 2 530 |
| Sewerage and Sanitation | |||||
| Does the municipality provide? | No | No | No | No | No |
| Number of households and non-domestic customers to which provided | 0 | 0 | 0 | 0 | 0 |
| Number of households using: | |||||
| Flush toilet - public sewerage | 0 | 0 | 0 | 0 | 0 |
| Flush toilet - septic tank | 0 | 0 | 0 | 0 | 0 |
| Ventilated pit latrine | 0 | 0 | 0 | 0 | 0 |
| Bucket system | 0 | 0 | 0 | 0 | 0 |
| Other | 0 | 0 | 0 | 0 | 0 |
| Domestic households with access to free basic service | 0 | 0 | 0 | 0 | 0 |
| Solid Waste Services | |||||
| Does the municipality provide? | Yes | Yes | Yes | Yes | Yes |
| Number of households and non-domestic customers to which provided | 7 598 | 7 598 | 7 598 | 7 598 | 7 598 |
| Domestic households with access to free basic service | 129 | 129 | 4 834 | 4 834 | 6 965 |