 B
B
Municipalities
Blue Crane Route Local Municipality (EC102)
Metropolitan, district, and local municipalities across South Africa.
Overview
Blue Crane Route Local Municipality (EC102) provides local government services and manages development priorities within its jurisdiction. It oversees municipal administration, service delivery functions, and local planning processes that support households, businesses, and community wellbeing. This page offers a consolidated public reference for key municipal information.
Geography, History & Economy
Blue Crane Route Local Municipality is part of Sarah Baartman District Municipality .
MDB code: EC102
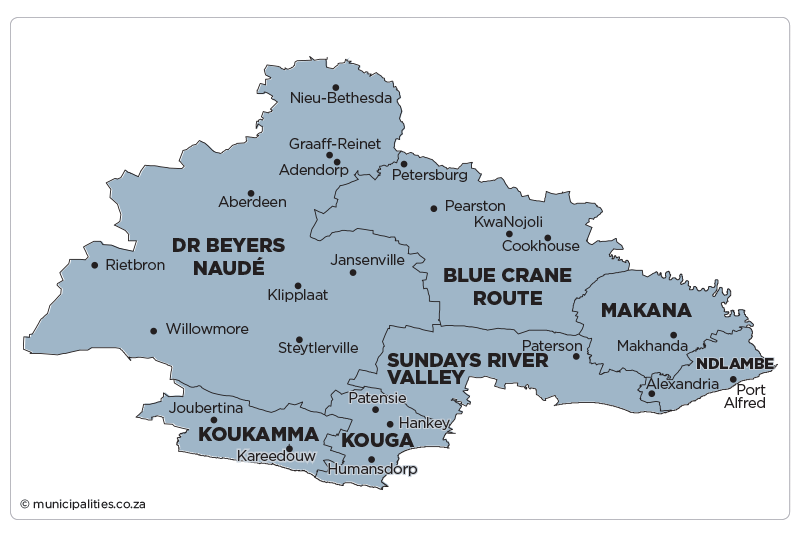
Description: The Blue Crane Route Local Municipality is a Category B municipality situated within the Sarah Baartman District in the Eastern Cape Province. It is bordered by the Chris Hani District in the north, Sundays River Valley in the south, Amathole District and Makana in the east, and Dr Beyers Naudé in the west. It is the second-largest municipality of seven in the district, accounting for 19% of the geographical area, and is an an administrative area. The municipality is named after the South African national bird, the blue crane.
Area: 11 068km²
Cities/Towns: Cookhouse, KwaNojoli (Somerset East), Pearston, Petersburg
Main Economic Sectors: Transport and communication (22.8%), government (18.8%), finance and business services (12.2%), manufacturing (12%), agriculture (11.3%), wholesale and retail trade (10.2%), community services (9%), construction (2%)
Open Tenders
View all →Map
Council & Management
Demographic Information
| 2022 | 2016 | 2011 | |
| Population | 49 883 | 36 063 | 36 002 |
| Age Structure | |||
| Population under 15 | 25.0% | 32.8% | 29.2% |
| Population 15 to 64 | 65.8% | 60.7% | 63.8% |
| Population over 65 | 9.2% | 6.5% | 7.0% |
| Dependency Ratio | |||
| Per 100 (15-64) | 52.0 | 64.7 | 56.8 |
| Sex Ratio | |||
| Males per 100 females | 94.2 | 97.9 | 96.5 |
| Population Growth | |||
| Per annum | 3.17% | 0.04% | n/a |
| Labour Market | |||
| Unemployment rate (official) | n/a | n/a | 30.7% |
| Youth unemployment rate (official) 15-34 | n/a | n/a | 40.0% |
| Education (aged 20 +) | |||
| No schooling | 7.8% | 6.2% | 10.5% |
| Matric | n/a | 20.5% | 18.9% |
| Higher education | 7.7% | 2.6% | 6.1% |
| Household Dynamics | |||
| Households | 16 117 | 9 876 | 9 761 |
| Average household size | 3.1 | 3.7 | 3.7 |
| Female headed households | n/a | 41.3% | 39.3% |
| Formal dwellings | 97.2% | 96.9% | 95.9% |
| Housing owned | n/a | 59.4% | 52.2% |
| Household Services | |||
| Flush toilet connected to sewerage | 87.2% | 86.5% | 84.5% |
| Weekly refuse removal | 76.0% | 86.1% | 80.3% |
| Piped water inside dwelling | 56.6% | 37.3% | 51.4% |
| Electricity for lighting | 92.2% | 88.7% | 86.9% |
Financial Results
| All values: R'000 | 2024/25 | 2023/24 | 2022/23 | 2021/22 | 2020/21 |
| AUDIT OUTCOME | n/a | Qualified audit | Financially unqualified | Financially unqualified | Financially unqualified |
| FINANCIAL PERFORMANCE | |||||
| Property rates | 22 662 | 28 215 | 24 316 | 23 816 | 23 686 |
| Service charges | 173 869 | 160 301 | 142 445 | 145 234 | 143 062 |
| Investment revenue | 5 332 | 3 801 | 1 102 | 935 | 592 |
| Transfers recognised - operational | 84 695 | 74 254 | 70 510 | 68 657 | 74 171 |
| Other own revenue | 19 891 | 17 498 | 12 937 | 11 410 | 7 357 |
| Total Revenue (excluding capital transfers and contributions) | 306 449 | 284 069 | 251 310 | 250 053 | 248 868 |
| Employee costs | 107 538 | 102 821 | 91 979 | 91 202 | 86 469 |
| Remuneration of councillors | 5 196 | 4 951 | 4 547 | 4 443 | 4 133 |
| Depreciation and amortisation | 88 343 | 58 872 | 53 415 | 56 449 | 646 |
| Finance charges | 23 187 | 13 837 | 3 687 | 3 371 | 1 211 |
| Inventory consumed and bulk purchases | 152 583 | 132 639 | 111 177 | 115 020 | 102 838 |
| Transfers and subsidies | 1 156 | 1 090 | 1 036 | 927 | 881 |
| Other expenditure | 74 076 | 75 698 | 52 774 | 50 346 | 50 595 |
| Total Expenditure | 452 079 | 389 907 | 318 615 | 321 757 | 246 773 |
| Surplus/(Deficit) | (145 629) | (105 837) | (67 305) | (71 704) | 2 095 |
| Transfers and subsidies - capital (monetary allocations) | 70 877 | 48 219 | 37 721 | 26 284 | 31 666 |
| Transfers and subsidies - capital (in-kind) | - | - | - | 2 900 | - |
| Surplus/(Deficit) after capital transfers & contributions | (74 752) | (57 619) | (29 584) | (42 520) | 33 761 |
| Share of surplus/(deficit) of associate | - | - | - | - | - |
| Surplus/(Deficit) for the year | (74 752) | (57 619) | (29 584) | (42 520) | 33 761 |
| CAPITAL EXPENDITURE & FUNDS SOURCES | |||||
| Capital expenditure | 27 830 | (16 361) | 46 720 | 3 381 | 29 575 |
| Transfers recognised - capital | 26 511 | (16 448) | 37 | - | 28 415 |
| Borrowing | - | 44 | - | - | - |
| Internally generated funds | 1 320 | 246 | 34 | - | 1 159 |
| Total sources of capital funds | 27 830 | (16 158) | 71 | - | 29 575 |
| FINANCIAL POSITION | |||||
| Total current assets | 146 458 | 139 000 | 105 252 | 96 137 | 74 801 |
| Total non current assets | 834 672 | 858 643 | 872 791 | 874 693 | 689 360 |
| Total current liabilities | 269 024 | 173 508 | 130 203 | 122 930 | 98 437 |
| Total non current liabilities | 65 812 | 62 439 | 61 406 | 33 844 | 26 911 |
| Community wealth/Equity | 646 294 | 761 695 | 786 434 | 856 576 | 605 052 |
| CASH FLOWS | |||||
| Net cash from (used) operating | 154 113 | 219 966 | 199 222 | 219 308 | 224 139 |
| Net cash from (used) investing | (46 904) | (33 504) | (20 632) | (1 709) | (2 884) |
| Net cash from (used) financing | - | - | - | - | - |
| Cash/cash equivalents at the year end | 147 345 | 196 955 | 200 016 | 243 744 | 230 929 |
| UNAUTHORISED, IRREGULAR, FRUITLESS & WASTEFUL EXPENDITURE | |||||
| Unauthorised expenditure | n/a | 12 255 | - | - | - |
| Irregular expenditure | n/a | 7 205 | 12 637 | 10 034 | 8 220 |
| Fruitless & wasteful expenditure | n/a | 16 289 | 304 | 43 | 6 |
| SOURCE | Audited Outcome A1 2026 Q1 | Audited Outcome A1 2026 Q1 | Audited Outcome A1 2026 Q1 | Audited Outcome A1 2024 | Audited Outcome A1 2023 |
Employment Statistics
| 2022/23 | 2021/22 | 2020/21 | 2019/20 | 2018/19 | |
| Employment | |||||
| Employment Costs (R’000) | 91 979 | 91 202 | 86 469 | 79 605 | 75 701 |
| Remuneration of councillors (R’000) | 4 547 | 4 443 | 4 133 | 4 051 | 3 994 |
| Total Employee Positions | 282 | 289 | 285 | 315 | 309 |
| Total Vacant Employee Positions | 12 | 14 | 0 | 7 | 5 |
| Total Vacancy Percentage | 4.26% | 4.84% | 0.00% | 2.22% | 1.62% |
| Managerial Positions – S54A and S56 | 5 | 5 | 5 | 5 | 5 |
| Vacant Managerial Positions – S54A and S56 | 0 | 0 | 0 | 1 | 0 |
| Managerial Positions - by organogram | 14 | 15 | 11 | 9 | 7 |
| Vacant Managerial Positions - by organogram | 5 | 4 | 0 | 1 | 0 |
Service Delivery Statistics
| 2022/23 | 2021/22 | 2020/21 | 2019/20 | 2018/19 | |
| Water | |||||
| Does the municipality provide? | Yes | Yes | Yes | Yes | Yes |
| Number of households and non-domestic customers to which provided | 10 814 | 10 798 | 10 125 | 8 103 | 7 417 |
| Number of domestic households/delivery points | 9 686 | 9 670 | 9 670 | 7 648 | 6 962 |
| Inside the yard | 8 558 | 8 542 | 8 542 | 7 258 | 6 962 |
| Less than 200m from yard | 930 | 930 | 930 | 390 | 0 |
| More than 200m from yard | 198 | 198 | 198 | 0 | 0 |
| Domestic households with access to free basic service | 3 561 | 4 323 | 4 236 | 4 103 | 4 039 |
| Electricity | |||||
| Does the municipality provide? | Yes | Yes | Yes | Yes | Yes |
| Number of households and non-domestic customers to which provided | 8 735 | 8 735 | 8 735 | 8 735 | 7 631 |
| Domestic households with access to free basic service | 3 561 | 4 323 | 4 236 | 4 103 | 4 039 |
| Sewerage and Sanitation | |||||
| Does the municipality provide? | Yes | Yes | Yes | Yes | Yes |
| Number of households and non-domestic customers to which provided | 11 618 | 11 224 | 11 224 | 9 709 | 9 709 |
| Number of households using: | |||||
| Flush toilet - public sewerage | 8 428 | 8 428 | 8 428 | 6 913 | 6 913 |
| Flush toilet - septic tank | 2 136 | 2 136 | 2 136 | 2 136 | 2 136 |
| Ventilated pit latrine | 0 | 0 | 0 | 0 | 0 |
| Bucket system | 753 | 359 | 359 | 359 | 359 |
| Other | 0 | 0 | 0 | 0 | 0 |
| Domestic households with access to free basic service | 3 561 | 4 323 | 4 236 | 4 103 | 4 039 |
| Solid Waste Services | |||||
| Does the municipality provide? | Yes | Yes | Yes | Yes | Yes |
| Number of households and non-domestic customers to which provided | 8 558 | 8 558 | 8 558 | 8 558 | 8 558 |
| Domestic households with access to free basic service | 3 561 | 4 323 | 4 236 | 4 103 | 4 039 |