 B
B
Municipalities
Buffalo City Metropolitan Municipality (BUF)
Metropolitan, district, and local municipalities across South Africa.
Overview
Buffalo City Metropolitan Municipality (BUF) is a metropolitan authority responsible for delivering municipal services at metro scale, including integrated planning and infrastructure management across a large urban area. It manages a wide range of functions that support residents, businesses, and public institutions, including service delivery systems and development programmes. This profile consolidates public reference information and provides context for the metro’s role in local government.
Geography, History & Economy
MDB code: BUF
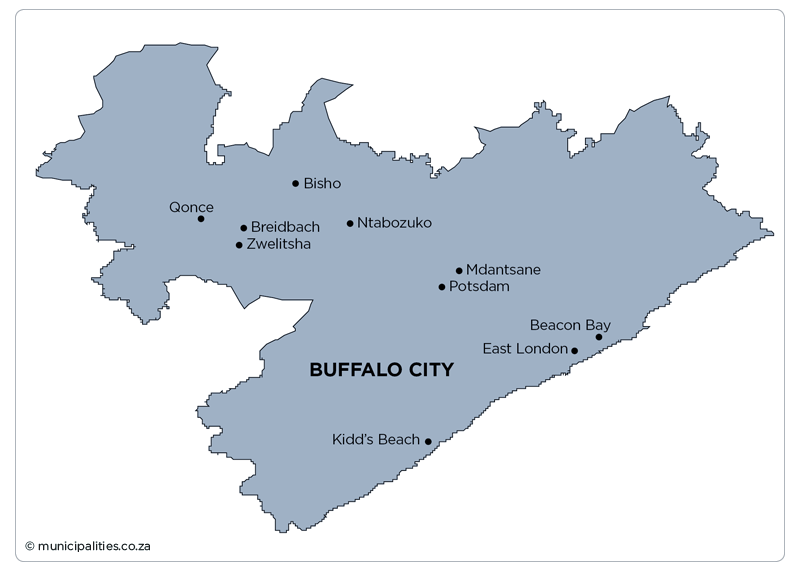
Description: The Buffalo City Metropolitan Municipality is a Category A municipality situated on the east coast of the Eastern Cape Province. The boundaries of the newly established municipality now include a large area characterised by very different features. Two former municipalities, Transitional Local Councils - that of KuGompo City (East London) and Qonce (King William's Town) - have merged into one. Other areas that were previously not included in either of them are now part of Buffalo City. The municipality was established as a local municipality in 2000 after South Africa's reorganisation of municipal areas and is named after the Buffalo River, at whose mouth lies the only river port in South Africa. On 18 May 2011 it was separated from the Amathole District Municipality and converted into a metropolitan municipality. History was made in Buffalo City when the City elected its first female mayor on Friday, 17 March 2006. The area has a well-developed manufacturing base, with the auto industry playing a major role. The climate is mild, with year-round sunshine. Average rainfall is 850mm.
Area: 2 753km²
Cities/Towns: Beacon Bay, Bisho, Breidbach, Dimbaza, Kidd's Beach, KuGompo City (East London), Mdantsane, Ntabozuko (Berlin), Phakamisa, Potsdam, Qonce (King William's Town), Zwelitsha
Main Economic Sectors: Agriculture (1.0%), mining (0.1%), manufacturing (14.1%), electricity (1.3%), construction (2.3%), trade (15.3%), transport (5.0%), finance (17.4%), community services (33.7%). As contribution to GVA - Source IDP 2024/25
Open Tenders
View all →Map
Council & Management
Demographic Information
| 2022 | 2016 | 2011 | |
| Population | 975 255 | 834 997 | 781 853 |
| Age Structure | |||
| Population under 15 | 24.8% | 31.6% | 26.5% |
| Population 15 to 64 | 67.4% | 64.4% | 67.4% |
| Population over 65 | 7.8% | 4.1% | 6.1% |
| Dependency Ratio | |||
| Per 100 (15-64) | 48.3 | 55.4 | 48.4 |
| Sex Ratio | |||
| Males per 100 females | 89.9 | 93.8 | 90.4 |
| Population Growth | |||
| Per annum | 2.15% | 1.52% | n/a |
| Labour Market | |||
| Unemployment rate (official) | n/a | n/a | n/a |
| Youth unemployment rate (official) 15-34 | n/a | n/a | n/a |
| Education (aged 20 +) | |||
| No schooling | 4.1% | 4.0% | 5.1% |
| Matric | n/a | 31.0% | 26.2% |
| Higher education | 15.0% | 13.7% | 13.2% |
| Household Dynamics | |||
| Households | 268 438 | 253 477 | 230 764 |
| Average household size | 3.6 | 3.3 | 3.4 |
| Female headed households | n/a | 45.3% | 45.9% |
| Formal dwellings | 85.6% | 70.2% | 71.9% |
| Housing owned | n/a | 54.2% | 50.5% |
| Household Services | |||
| Flush toilet connected to sewerage | 80.7% | 73.1% | 69.1% |
| Weekly refuse removal | 71.3% | 57.1% | 68.2% |
| Piped water inside dwelling | 65.7% | 50.2% | 51.0% |
| Electricity for lighting | 94.6% | 86.6% | 80.9% |
Financial Results
| All values: R'000 | 2024/25 | 2023/24 | 2022/23 | 2021/22 | 2020/21 |
| AUDIT OUTCOME | n/a | Qualified audit | Qualified audit | Financially unqualified | Qualified audit |
| FINANCIAL PERFORMANCE | |||||
| Property rates | 2 169 015 | 2 127 634 | 1 791 370 | 1 733 914 | 1 589 415 |
| Service charges | 4 994 155 | 4 333 829 | 3 766 315 | 4 312 993 | 3 937 345 |
| Investment revenue | 72 215 | 51 630 | 47 660 | 33 086 | 41 289 |
| Transfers recognised - operational | 1 482 149 | 1 382 876 | 1 192 815 | 1 099 255 | 1 921 555 |
| Other own revenue | 1 561 577 | 1 457 454 | 1 254 561 | 1 069 938 | 395 202 |
| Total Revenue (excluding capital transfers and contributions) | 10 279 111 | 9 353 422 | 8 052 721 | 8 249 186 | 7 884 807 |
| Employee costs | 2 787 521 | 2 703 201 | 2 475 613 | 2 536 403 | 2 501 193 |
| Remuneration of councillors | 70 373 | 68 967 | 66 749 | 64 683 | 63 813 |
| Depreciation and amortisation | 2 362 853 | 1 944 481 | 1 846 054 | 1 569 797 | 1 401 969 |
| Finance charges | 44 449 | 46 211 | 16 075 | 20 684 | 25 757 |
| Inventory consumed and bulk purchases | 2 983 798 | 2 589 319 | 2 256 205 | 2 293 210 | 1 959 822 |
| Transfers and subsidies | 102 451 | 131 531 | 137 495 | 127 299 | 104 912 |
| Other expenditure | 3 783 761 | 3 287 771 | 2 312 445 | 2 589 020 | 2 219 522 |
| Total Expenditure | 12 135 204 | 10 771 481 | 9 110 636 | 9 201 096 | 8 276 988 |
| Surplus/(Deficit) | (1 856 094) | (1 418 058) | (1 057 916) | (951 910) | (392 181) |
| Transfers and subsidies - capital (monetary allocations) | 773 040 | 855 178 | 744 644 | 687 065 | 1 070 973 |
| Transfers and subsidies - capital (in-kind) | 5 666 | 22 409 | 4 160 | 2 294 | 10 036 |
| Surplus/(Deficit) after capital transfers & contributions | (1 077 387) | (540 471) | (309 111) | (262 551) | 688 828 |
| Share of surplus/(deficit) of associate | 1 976 | (40 750) | 20 143 | - | - |
| Surplus/(Deficit) for the year | (1 075 412) | (581 222) | (288 968) | (262 551) | 688 828 |
| CAPITAL EXPENDITURE & FUNDS SOURCES | |||||
| Capital expenditure | 1 194 798 | 1 110 164 | 1 425 946 | 1 408 515 | 1 591 352 |
| Transfers recognised - capital | 702 486 | 763 360 | 696 267 | 624 388 | 970 986 |
| Borrowing | - | - | - | 11 727 | 3 079 |
| Internally generated funds | 492 312 | 346 805 | 729 679 | 772 324 | 617 287 |
| Total sources of capital funds | 1 194 798 | 1 110 164 | 1 425 946 | 1 408 439 | 1 591 352 |
| FINANCIAL POSITION | |||||
| Total current assets | 13 548 216 | 12 514 205 | 11 194 274 | 10 217 212 | 9 662 966 |
| Total non current assets | 42 430 562 | 31 714 709 | 26 076 177 | 25 670 881 | 22 692 272 |
| Total current liabilities | 11 697 176 | 10 993 173 | 10 171 137 | 8 865 399 | 8 116 984 |
| Total non current liabilities | 1 325 199 | 961 557 | 951 998 | 1 143 933 | 1 072 361 |
| Community wealth/Equity | 45 618 348 | 32 274 185 | 26 147 314 | 25 878 762 | 23 165 893 |
| CASH FLOWS | |||||
| Net cash from (used) operating | 5 742 959 | 3 393 146 | 4 913 551 | 4 248 326 | 4 317 844 |
| Net cash from (used) investing | (1 176 149) | (1 110 048) | (1 425 944) | (1 407 092) | (1 586 520) |
| Net cash from (used) financing | (30 346) | (30 246) | (49 141) | (45 191) | (54 396) |
| Cash/cash equivalents at the year end | 5 257 451 | 2 932 826 | 4 135 924 | 3 941 451 | 4 050 639 |
| UNAUTHORISED, IRREGULAR, FRUITLESS & WASTEFUL EXPENDITURE | |||||
| Unauthorised expenditure | n/a | 403 496 | - | 163 702 | - |
| Irregular expenditure | n/a | 1 317 740 | 1 713 312 | 6 523 479 | 311 223 |
| Fruitless & wasteful expenditure | n/a | 693 | 54 | 10 732 | - |
| SOURCE | Audited Outcome A1 2026 Q1 | Audited Outcome A1 2026 Q1 | Audited Outcome A1 2026 Q1 | Audited Outcome A1 2024 | Audited Outcome A1 2023 |
Employment Statistics
| 2022/23 | 2021/22 | 2020/21 | 2019/20 | 2018/19 | |
| Employment | |||||
| Employment Costs (R’000) | 2 475 613 | 2 536 403 | 2 501 193 | 2 206 010 | 2 049 372 |
| Remuneration of councillors (R’000) | 66 749 | 64 683 | 63 813 | 64 687 | 62 316 |
| Total Employee Positions | 6 148 | 6 005 | 5 519 | 5 992 | 6 085 |
| Total Vacant Employee Positions | 761 | 611 | 1 | 329 | 786 |
| Total Vacancy Percentage | 12.38% | 10.17% | 0.02% | 5.49% | 12.92% |
| Managerial Positions – S54A and S56 | 10 | 10 | 10 | 10 | 8 |
| Vacant Managerial Positions – S54A and S56 | 0 | 1 | 1 | 1 | 0 |
| Managerial Positions - by organogram | 251 | 244 | 198 | 199 | 256 |
| Vacant Managerial Positions - by organogram | 20 | 23 | 0 | 0 | 63 |
Service Delivery Statistics
| 2022/23 | 2021/22 | 2020/21 | 2019/20 | 2018/19 | |
| Water | |||||
| Does the municipality provide? | Yes | Yes | Yes | Yes | Yes |
| Number of households and non-domestic customers to which provided | 299 932 | 299 415 | 306 071 | 305 569 | 258 456 |
| Number of domestic households/delivery points | 292 777 | 292 260 | 298 915 | 298 413 | 251 745 |
| Inside the yard | 161 520 | 161 144 | 166 294 | 165 705 | 122 000 |
| Less than 200m from yard | 129 436 | 128 995 | 126 521 | 127 638 | 125 031 |
| More than 200m from yard | 1 821 | 2 121 | 6 100 | 5 070 | 4 714 |
| Domestic households with access to free basic service | 52 432 | 82 878 | 124 152 | 125 352 | 125 641 |
| Electricity | |||||
| Does the municipality provide? | Yes | Yes | Yes | Yes | Yes |
| Number of households and non-domestic customers to which provided | 167 812 | 167 706 | 167 095 | 166 190 | 163 702 |
| Domestic households with access to free basic service | 52 432 | 51 547 | 60 529 | 61 320 | 80 831 |
| Sewerage and Sanitation | |||||
| Does the municipality provide? | Yes | Yes | Yes | Yes | Yes |
| Number of households and non-domestic customers to which provided | 253 859 | 252 332 | 250 033 | 245 143 | 240 371 |
| Number of households using: | |||||
| Flush toilet - public sewerage | 161 520 | 161 520 | 166 294 | 165 705 | 159 697 |
| Flush toilet - septic tank | 5 437 | 5 437 | 0 | 0 | 5 437 |
| Ventilated pit latrine | 53 295 | 51 895 | 50 355 | 47 087 | 43 353 |
| Bucket system | 0 | 0 | 0 | 0 | 0 |
| Other | 26 452 | 26 325 | 26 228 | 25 425 | 24 958 |
| Domestic households with access to free basic service | 32 135 | 40 738 | 40 150 | 61 320 | 80 831 |
| Solid Waste Services | |||||
| Does the municipality provide? | Yes | Yes | Yes | Yes | Yes |
| Number of households and non-domestic customers to which provided | 157 392 | 157 392 | 149 551 | 149 551 | 128 046 |
| Domestic households with access to free basic service | 45 945 | 43 453 | 45 436 | 61 320 | 80 831 |