 C
C
Municipalities
Cape Agulhas Local Municipality (WC033)
Metropolitan, district, and local municipalities across South Africa.
Overview
Cape Agulhas Local Municipality (WC033) is responsible for municipal service delivery and governance within its area of jurisdiction. It manages local administration, planning, and service coordination that supports community wellbeing and local economic activity. This profile offers a structured public reference for the municipality’s key information.
Geography, History & Economy
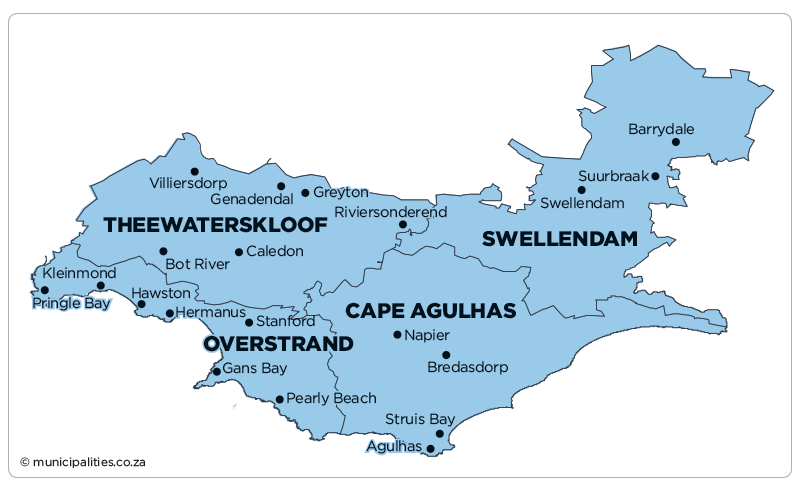
Cape Agulhas Local Municipality is part of Overberg District Municipality .
MDB code: WC033
Description: The Cape Agulhas Local Municipality is a Category B municipality situated within the Overberg District in the Western Cape Province. It is one of four municipalities in the district, making up a third of its geographical area. A large percentage of the population falls within the economically active population (aged 15-65), but the unemployment rate in Cape Agulhas is still relatively high. Though regarded as one of the best-performing local governments when it comes to housing delivery, the housing backlogs remain a challenge. The municipality strives to improve basic services with limited resources, however, the upgrading and maintenance of basic services remain a challenge. Strategic partnerships have become increasingly important, as illustrated by council's high expenditure on MIG projects and active participation in EPWP projects. Environmental issues have become an important factor for the municipality to consider, especially with the effects of global warming and climate change. The municipality is endeavouring to integrate the effects and consequences of global warming and climate change into the general planning of service delivery, as can be seen in the municipality's awarding of a waste to energy bioproject to Ark Industries. The municipality has created adequate capacity to deliver in critical departments such as economic development, human settlements and human development. Good governance has always been a priority for the council and the establishment of a Risk Management Unit, an Internal Audit Unit, a Municipal Public Accounts Committee, as well as more than 13 years of unqualified audit reports, is a testimony to this.
Area: 3 470km²
Cities/Towns: Agulhas, Arniston, Bredasdorp, Elim, Klipdale, Napier, Protem, Struis Bay, Suiderstrand
Main Economic Sectors: Agriculture, forestry and fishing (25%), manufacturing (5%), construction (25%), transport, storage and communication (15%), mining and quarrying (5%), electricity, gas and water (5%), wholesale and retail trade, catering and accommodation (5%), finance, insurance, real estate and business services (25%), community, social and personal services (5.5%). As contribution to GDP - Source IDP 2024/25
Open Tenders
View all →Map
Council & Management
Demographic Information
| 2022 | 2016 | 2011 | |
| Population | 40 274 | 36 000 | 33 038 |
| Age Structure | |||
| Population under 15 | 19.5% | 24.6% | 23.4% |
| Population 15 to 64 | 68.7% | 67.6% | 67.6% |
| Population over 65 | 11.8% | 7.8% | 8.9% |
| Dependency Ratio | |||
| Per 100 (15-64) | 45.6 | 48.0 | 47.9 |
| Sex Ratio | |||
| Males per 100 females | 93.5 | 98.1 | 96.6 |
| Population Growth | |||
| Per annum | 1.92% | 1.95% | n/a |
| Labour Market | |||
| Unemployment rate (official) | n/a | n/a | 13.8% |
| Youth unemployment rate (official) 15-34 | n/a | n/a | 19.5% |
| Education (aged 20 +) | |||
| No schooling | 4.1% | 1.5% | 3.5% |
| Matric | n/a | 27.6% | 22.4% |
| Higher education | 14.6% | 6.9% | 12.6% |
| Household Dynamics | |||
| Households | 16 220 | 11 321 | 10 162 |
| Average household size | 2.5 | 3.2 | 3.3 |
| Female headed households | n/a | 34.0% | 32.1% |
| Formal dwellings | 94.4% | 88.1% | 85.2% |
| Housing owned | n/a | 76.5% | 63.2% |
| Household Services | |||
| Flush toilet connected to sewerage | 98.6% | 87.4% | 90.4% |
| Weekly refuse removal | 92.8% | 90.2% | 80.0% |
| Piped water inside dwelling | 94.4% | 84.5% | 81.8% |
| Electricity for lighting | 99.3% | 96.5% | 96.7% |
Financial Results
| All values: R'000 | 2024/25 | 2023/24 | 2022/23 | 2021/22 | 2020/21 |
| AUDIT OUTCOME | n/a | Clean audit | Clean audit | Clean audit | Clean audit |
| FINANCIAL PERFORMANCE | |||||
| Property rates | 101 430 | 94 125 | 87 883 | 81 031 | 77 423 |
| Service charges | 282 616 | 253 793 | 225 179 | 224 928 | 197 038 |
| Investment revenue | 5 219 | 8 944 | 9 475 | 4 783 | 3 138 |
| Transfers recognised - operational | 58 216 | 51 362 | 53 136 | 48 416 | 46 733 |
| Other own revenue | 49 204 | 38 284 | 30 010 | 35 277 | 29 897 |
| Total Revenue (excluding capital transfers and contributions) | 496 684 | 446 509 | 405 684 | 394 435 | 354 229 |
| Employee costs | 193 534 | 176 745 | 163 551 | 157 389 | 157 304 |
| Remuneration of councillors | 6 766 | 5 932 | 5 577 | 5 577 | 5 626 |
| Depreciation and amortisation | 21 858 | 11 295 | 21 507 | 19 950 | 16 715 |
| Finance charges | 7 367 | 6 016 | 8 264 | 9 430 | 6 972 |
| Inventory consumed and bulk purchases | 176 334 | 161 640 | 135 435 | 130 834 | 111 236 |
| Transfers and subsidies | 2 228 | 1 945 | 1 999 | 2 354 | 2 987 |
| Other expenditure | 100 522 | 66 919 | 82 045 | 60 934 | 52 590 |
| Total Expenditure | 508 609 | 430 492 | 418 379 | 386 468 | 353 430 |
| Surplus/(Deficit) | (11 925) | 16 017 | (12 695) | 7 968 | 798 |
| Transfers and subsidies - capital (monetary allocations) | 19 390 | 10 637 | 22 591 | 25 467 | 15 772 |
| Transfers and subsidies - capital (in-kind) | - | - | - | - | - |
| Surplus/(Deficit) after capital transfers & contributions | 7 465 | 26 654 | 9 895 | 33 435 | 16 571 |
| Share of surplus/(deficit) of associate | - | - | - | - | - |
| Surplus/(Deficit) for the year | 7 465 | 26 654 | 9 895 | 33 435 | 16 571 |
| CAPITAL EXPENDITURE & FUNDS SOURCES | |||||
| Capital expenditure | 58 965 | 49 425 | - | (0) | (0) |
| Transfers recognised - capital | 18 684 | 16 661 | 18 465 | 24 729 | 15 093 |
| Borrowing | 20 931 | 14 600 | 14 145 | 13 718 | 31 181 |
| Internally generated funds | 19 350 | 18 164 | (30 854) | (19 730) | 11 745 |
| Total sources of capital funds | 58 965 | 49 425 | 1 756 | 18 716 | 58 018 |
| FINANCIAL POSITION | |||||
| Total current assets | 123 071 | 145 919 | 179 380 | 192 265 | 159 656 |
| Total non current assets | 660 589 | 639 305 | 601 159 | 561 364 | 526 114 |
| Total current liabilities | 122 698 | 80 965 | 90 461 | 93 068 | 86 339 |
| Total non current liabilities | 179 179 | 179 161 | 181 421 | 180 793 | 152 328 |
| Community wealth/Equity | 481 784 | 525 097 | 508 658 | 479 768 | 447 103 |
| CASH FLOWS | |||||
| Net cash from (used) operating | 15 089 | 176 150 | 469 785 | 472 143 | 53 614 |
| Net cash from (used) investing | (48 238) | (60 906) | (41 506) | (36 203) | (46 300) |
| Net cash from (used) financing | 671 | 1 300 | - | 34 626 | 34 200 |
| Cash/cash equivalents at the year end | 30 820 | 236 119 | 547 853 | 594 023 | 150 875 |
| UNAUTHORISED, IRREGULAR, FRUITLESS & WASTEFUL EXPENDITURE | |||||
| Unauthorised expenditure | n/a | 30 576 | 8 554 | 2 665 | 7 636 |
| Irregular expenditure | n/a | 113 716 | 2 946 | 9 659 | 4 150 |
| Fruitless & wasteful expenditure | n/a | 203 | 438 | 25 | - |
| SOURCE | Audited Outcome A1 2026 Q1 | Audited Outcome A1 2026 Q1 | Audited Outcome A1 2026 Q1 | Audited Outcome A1 2024 | Audited Outcome A1 2023 |
Employment Statistics
| 2022/23 | 2021/22 | 2020/21 | 2019/20 | 2018/19 | |
| Employment | |||||
| Employment Costs (R’000) | 163 551 | 157 389 | 157 304 | 130 122 | 114 077 |
| Remuneration of councillors (R’000) | 5 577 | 5 577 | 5 626 | 5 632 | 5 441 |
| Total Employee Positions | 392 | 389 | 361 | 375 | 384 |
| Total Vacant Employee Positions | 27 | 27 | 2 | 2 | 16 |
| Total Vacancy Percentage | 6.89% | 6.94% | 0.55% | 0.53% | 4.17% |
| Managerial Positions – S54A and S56 | 4 | 4 | 4 | 4 | 3 |
| Vacant Managerial Positions – S54A and S56 | 0 | 0 | 0 | 0 | 0 |
| Managerial Positions - by organogram | 27 | 27 | 27 | 27 | 18 |
| Vacant Managerial Positions - by organogram | 10 | 9 | 2 | 2 | 0 |
Service Delivery Statistics
| 2022/23 | 2021/22 | 2020/21 | 2019/20 | 2018/19 | |
| Water | |||||
| Does the municipality provide? | Yes | Yes | Yes | Yes | Yes |
| Number of households and non-domestic customers to which provided | 11 381 | 11 101 | 11 010 | 10 462 | 10 152 |
| Number of domestic households/delivery points | 10 821 | 10 541 | 10 450 | 9 902 | 9 558 |
| Inside the yard | 9 995 | 9 841 | 9 697 | 9 149 | 8 805 |
| Less than 200m from yard | 826 | 700 | 753 | 753 | 753 |
| More than 200m from yard | 0 | 0 | 0 | 0 | 0 |
| Domestic households with access to free basic service | 3 214 | 3 368 | 3 713 | 3 476 | 3 008 |
| Electricity | |||||
| Does the municipality provide? | Yes | Yes | Yes | Yes | Yes |
| Number of households and non-domestic customers to which provided | 10 116 | 9 732 | 9 732 | 9 634 | 9 536 |
| Domestic households with access to free basic service | 3 214 | 3 368 | 3 713 | 3 476 | 3 008 |
| Sewerage and Sanitation | |||||
| Does the municipality provide? | Yes | Yes | Yes | Yes | Yes |
| Number of households and non-domestic customers to which provided | 11 413 | 11 163 | 11 068 | 10 738 | 10 756 |
| Number of households using: | |||||
| Flush toilet - public sewerage | 6 803 | 6 747 | 6 627 | 6 364 | 5 991 |
| Flush toilet - septic tank | 3 224 | 3 156 | 3 119 | 3 052 | 3 004 |
| Ventilated pit latrine | 0 | 0 | 0 | 0 | 0 |
| Bucket system | 0 | 0 | 0 | 0 | 0 |
| Other | 826 | 700 | 762 | 762 | 762 |
| Domestic households with access to free basic service | 3 214 | 3 368 | 3 713 | 3 476 | 3 008 |
| Solid Waste Services | |||||
| Does the municipality provide? | Yes | Yes | Yes | Yes | Yes |
| Number of households and non-domestic customers to which provided | 10 829 | 10 573 | 9 723 | 9 707 | 9 707 |
| Domestic households with access to free basic service | 3 214 | 3 368 | 3 713 | 3 476 | 3 008 |