 C
C
Municipalities
Cape Winelands District Municipality (DC2)
Metropolitan, district, and local municipalities across South Africa.
Overview
Cape Winelands District Municipality (DC2) coordinates regional planning and supports service delivery and development across its local municipalities. It contributes to integrated district development planning, infrastructure coordination, and support functions where district capacity improves outcomes. This profile consolidates public reference information and clarifies the district’s role in local government.
Geography, History & Economy
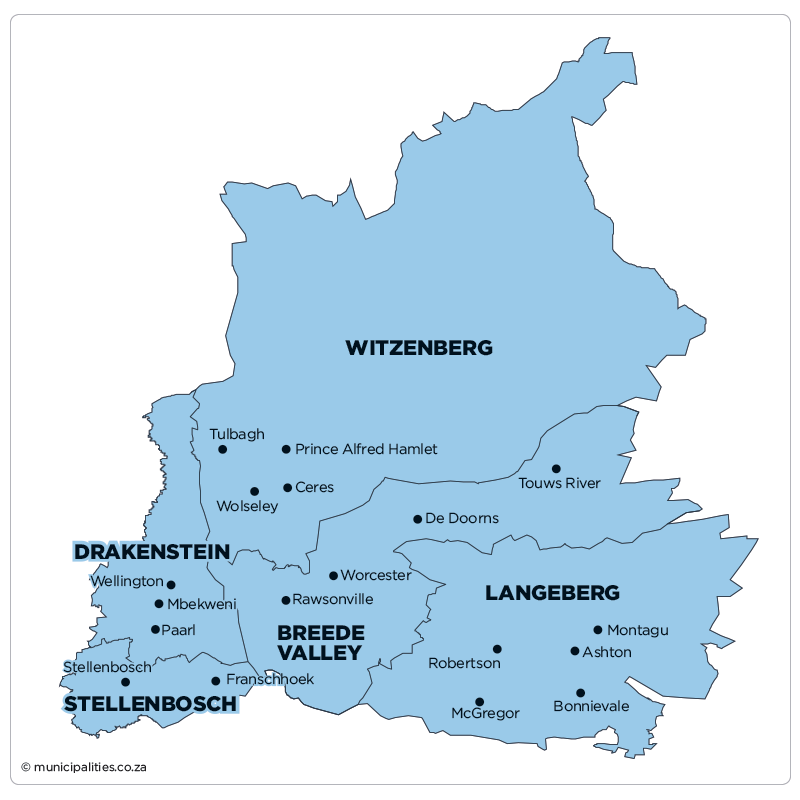
Cape Winelands District Municipality comprises:
- Breede Valley Local Municipality
- Drakenstein Local Municipality
- Langeberg Local Municipality
- Stellenbosch Local Municipality
- Witzenberg Local Municipality
MDB code: DC2
Description: The Cape Winelands District Municipality (CWDM) is a Category C municipality situated in the Western Cape Province next to the Cape Metropolitan area. It was formerly known as the Boland District Municipality. CWDM is a landlocked area in between the West Coast and Overberg coastal districts. The district includes five local municipalities, namely: Drakenstein, Stellenbosch, Witzenberg, Breede Valley and Langeberg. The area is one of the 'pearls' of South Africa's rural and small-town subregions, but disparate with a relatively high and diverse level of development. It's a superb wine-producing area, and indeed the best known in South Africa. The magnificent mountain ranges around Stellenbosch and Franschhoek provide ideal microclimates for the vines.
Area: 21 478km²
Cities/Towns: Ashton, Bonnievale, Ceres, De Doorns, Franschhoek, Gouda, Gouda, Hermon, Klapmuts, Mbekweni, McGregor, Montagu, Op-Die-Berg, Paarl, Pniel, Prince Alfred Hamlet, Rawsonville, Robertson, Saron, Saron, Simondium, Stellenbosch, Stellenbosch Farms, Touws River, Tulbagh, Wellington, Wolseley, Worcester
Main Economic Sectors: Finance and business services (23.9%), manufacturing (19.6%), wholesale and retail trade (15.2%), agriculture, forestry and fishing (13.1%), transport and communication (9%), construction (4.5%)
Open Tenders
View all →Map
Council & Management
Demographic Information
| 2022 | 2016 | 2011 | |
| Population | 862 703 | 866 001 | 787 486 |
| Age Structure | |||
| Population under 15 | 22.3% | 26.6% | 25.8% |
| Population 15 to 64 | 71.1% | 68.9% | 69.0% |
| Population over 65 | 6.6% | 4.4% | 5.1% |
| Dependency Ratio | |||
| Per 100 (15-64) | 40.7 | 45.1 | 44.9 |
| Sex Ratio | |||
| Males per 100 females | 94.1 | 98.3 | 97.2 |
| Population Growth | |||
| Per annum | 0.89% | 2.16% | n/a |
| Labour Market | |||
| Unemployment rate (official) | n/a | n/a | n/a |
| Youth unemployment rate (official) 15-34 | n/a | n/a | n/a |
| Education (aged 20 +) | |||
| No schooling | 3.3% | 2.5% | 4.4% |
| Matric | n/a | 30.0% | 23.5% |
| Higher education | 15.2% | 9.0% | 10.5% |
| Household Dynamics | |||
| Households | 242 283 | 235 906 | 198 258 |
| Average household size | 3.6 | 3.7 | 4.0 |
| Female headed households | n/a | 34.2% | 33.2% |
| Formal dwellings | 88.8% | 81.0% | 82.3% |
| Housing owned | n/a | 48.7% | 41.2% |
| Household Services | |||
| Flush toilet connected to sewerage | 96.2% | 93.5% | 91.0% |
| Weekly refuse removal | 85.6% | 81.8% | 79.9% |
| Piped water inside dwelling | 87.1% | 77.3% | 75.9% |
| Electricity for lighting | 97.1% | 94.1% | 92.8% |
Financial Results
| All values: R'000 | 2024/25 | 2023/24 | 2022/23 | 2021/22 | 2020/21 |
| AUDIT OUTCOME | n/a | Clean audit | Clean audit | Clean audit | Clean audit |
| FINANCIAL PERFORMANCE | |||||
| Property rates | - | - | - | - | - |
| Service charges | - | - | - | - | - |
| Investment revenue | 86 566 | 89 962 | 62 999 | 40 295 | 38 232 |
| Transfers recognised - operational | 272 374 | 265 526 | 256 948 | 253 669 | 245 867 |
| Other own revenue | 153 565 | 130 632 | 130 373 | 117 640 | 117 160 |
| Total Revenue (excluding capital transfers and contributions) | 512 505 | 486 120 | 450 319 | 411 604 | 401 259 |
| Employee costs | 256 198 | 241 636 | 221 174 | 218 979 | 213 079 |
| Remuneration of councillors | 15 245 | 14 587 | 13 607 | 12 745 | 12 657 |
| Depreciation and amortisation | 8 648 | 11 718 | 9 267 | 9 788 | 9 238 |
| Finance charges | 2 462 | 1 904 | - | - | - |
| Inventory consumed and bulk purchases | 31 347 | 25 048 | 36 915 | 21 452 | 28 215 |
| Transfers and subsidies | 14 187 | 13 795 | 12 400 | 16 988 | 12 173 |
| Other expenditure | 134 024 | 155 108 | 107 206 | 97 921 | 89 677 |
| Total Expenditure | 462 111 | 463 796 | 400 569 | 377 873 | 365 040 |
| Surplus/(Deficit) | 50 394 | 22 324 | 49 750 | 33 731 | 36 218 |
| Transfers and subsidies - capital (monetary allocations) | 807 | 1 763 | 817 | 54 | 214 |
| Transfers and subsidies - capital (in-kind) | - | - | - | 929 | - |
| Surplus/(Deficit) after capital transfers & contributions | 51 201 | 24 087 | 50 567 | 34 714 | 36 432 |
| Share of surplus/(deficit) of associate | - | - | - | - | - |
| Surplus/(Deficit) for the year | 51 201 | 24 087 | 50 567 | 34 714 | 36 432 |
| CAPITAL EXPENDITURE & FUNDS SOURCES | |||||
| Capital expenditure | 104 412 | 39 690 | 20 736 | 3 133 | 5 602 |
| Transfers recognised - capital | 745 | 1 666 | 817 | 54 | 214 |
| Borrowing | 90 888 | - | - | - | - |
| Internally generated funds | 12 779 | 38 024 | 19 919 | 2 150 | 5 389 |
| Total sources of capital funds | 104 412 | 39 690 | 20 736 | 2 204 | 5 602 |
| FINANCIAL POSITION | |||||
| Total current assets | 532 715 | 506 247 | 713 177 | 844 308 | 794 505 |
| Total non current assets | 687 313 | 561 924 | 336 839 | 154 247 | 163 455 |
| Total current liabilities | 80 430 | 53 954 | 54 706 | 48 602 | 48 336 |
| Total non current liabilities | 228 721 | 154 540 | 144 626 | 149 836 | 144 709 |
| Community wealth/Equity | 910 877 | 859 677 | 850 684 | 800 117 | 755 190 |
| CASH FLOWS | |||||
| Net cash from (used) operating | (138 113) | (180 780) | 379 899 | 414 909 | (2 846) |
| Net cash from (used) investing | (114 754) | (244 141) | (174 020) | - | (1 441) |
| Net cash from (used) financing | 53 150 | - | 3 | - | - |
| Cash/cash equivalents at the year end | 224 529 | 218 620 | 996 210 | 1 181 063 | 712 705 |
| UNAUTHORISED, IRREGULAR, FRUITLESS & WASTEFUL EXPENDITURE | |||||
| Unauthorised expenditure | n/a | - | - | - | - |
| Irregular expenditure | n/a | - | - | - | 1 486 |
| Fruitless & wasteful expenditure | n/a | - | 0 | - | - |
| SOURCE | Audited Outcome A1 2026 Q1 | Audited Outcome A1 2026 Q1 | Audited Outcome A1 2026 Q1 | Audited Outcome A1 2024 | Audited Outcome A1 2023 |
Employment Statistics
| 2022/23 | 2021/22 | 2020/21 | 2019/20 | 2018/19 | |
| Employment | |||||
| Employment Costs (R’000) | 221 174 | 218 979 | 213 079 | 202 286 | 178 159 |
| Remuneration of councillors (R’000) | 13 607 | 12 745 | 12 657 | 12 610 | 12 171 |
| Total Employee Positions | 422 | 498 | 421 | 423 | 470 |
| Total Vacant Employee Positions | 29 | 98 | 8 | 3 | 42 |
| Total Vacancy Percentage | 6.87% | 19.68% | 1.90% | 0.71% | 8.94% |
| Managerial Positions – S54A and S56 | 4 | 4 | 4 | 4 | 4 |
| Vacant Managerial Positions – S54A and S56 | 0 | 0 | 0 | 0 | 0 |
| Managerial Positions - by organogram | 43 | 43 | 43 | 43 | 43 |
| Vacant Managerial Positions - by organogram | 3 | 9 | 8 | 3 | 1 |
Service Delivery Statistics
| 2022/23 | 2021/22 | 2020/21 | 2019/20 | 2018/19 | |
| Water | |||||
| Does the municipality provide? | No | No | No | No | No |
| Number of households and non-domestic customers to which provided | 0 | 0 | 0 | 0 | 0 |
| Number of domestic households/delivery points | 0 | 0 | 0 | 0 | 0 |
| Inside the yard | 0 | 0 | 0 | 0 | 0 |
| Less than 200m from yard | 0 | 0 | 0 | 0 | 0 |
| More than 200m from yard | 0 | 0 | 0 | 0 | 0 |
| Domestic households with access to free basic service | 0 | 0 | 0 | 0 | 0 |
| Electricity | |||||
| Does the municipality provide? | No | No | No | No | No |
| Number of households and non-domestic customers to which provided | 0 | 0 | 0 | 0 | 0 |
| Domestic households with access to free basic service | 0 | 0 | 0 | 0 | 0 |
| Sewerage and Sanitation | |||||
| Does the municipality provide? | No | No | No | No | No |
| Number of households and non-domestic customers to which provided | 0 | 0 | 0 | 0 | 0 |
| Number of households using: | |||||
| Flush toilet - public sewerage | 0 | 0 | 0 | 0 | 0 |
| Flush toilet - septic tank | 0 | 0 | 0 | 0 | 0 |
| Ventilated pit latrine | 0 | 0 | 0 | 0 | 0 |
| Bucket system | 0 | 0 | 0 | 0 | 0 |
| Other | 0 | 0 | 0 | 0 | 0 |
| Domestic households with access to free basic service | 0 | 0 | 0 | 0 | 0 |
| Solid Waste Services | |||||
| Does the municipality provide? | No | No | No | No | No |
| Number of households and non-domestic customers to which provided | 0 | 0 | 0 | 0 | 0 |
| Domestic households with access to free basic service | 0 | 0 | 0 | 0 | 0 |