 C
C
Municipalities
Capricorn District Municipality (DC35)
Metropolitan, district, and local municipalities across South Africa.
Overview
Capricorn District Municipality (DC35) is a district authority responsible for coordinating development planning and supporting service delivery across its constituent local municipalities. It plays a role in strategic infrastructure planning, inter-municipal coordination, and shared services where scale is important. This profile provides a structured public reference and context for the district’s governance role.
Geography, History & Economy
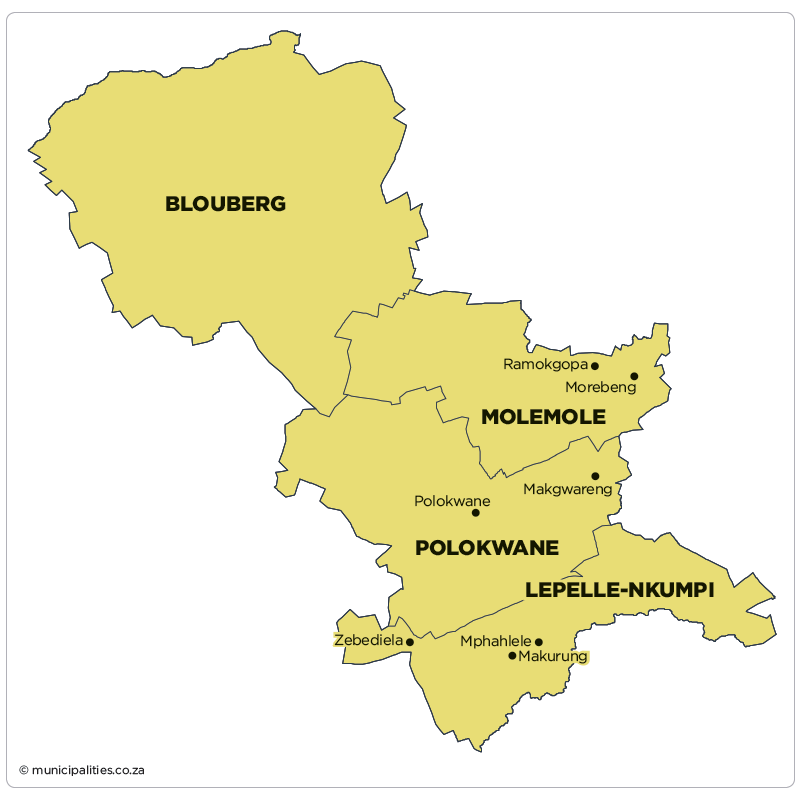
Capricorn District Municipality comprises:
- Blouberg Local Municipality
- Lepelle-Nkumpi Local Municipality
- Molemole Local Municipality
- Polokwane Local Municipality
MDB code: DC35
Description: The Capricorn District Municipality is a Category C municipality situated in the Limpopo Province. The municipality is situated as a stopover between Gauteng and the northern areas of Limpopo, and between the north-western areas and the Kruger National Park. It forms a gateway to Botswana, Zimbabwe and Mozambique. It consists of the following four local municipalities: Blouberg, Lepelle-Nkumpi, Molemole and Polokwane. It derives its name from the Tropic of Capricorn, along which it is situated. Limpopo's capital, Polokwane (previously Pietersburg), lies in the heart of the Capricorn region. The district has an internal airport, and is linked to Gauteng by one of the best stretches of the N1 in South Africa. It has the third-largest district economy in the province, and is predominantly rural in nature.
Area: 21 706km²
Cities/Towns: Alldays, Dendron, Morebeng (Soekmekaar), Polokwane, Senwabarwana (Bochum), Zebediela
Main Economic Sectors: Agriculture (22.7%), mining (12.7%), manufacturing (44.2%), electricity (12.1%), construction (39.4%), trade (44.6%), transport (45.3%), finance (38.1%), community services (43.4%). As contribution to GVA - Source IDP 2024/25
Open Tenders
View all →Map
Council & Management
Demographic Information
| 2022 | 2016 | 2011 | |
| Population | 1 447 103 | 1 330 436 | 1 261 463 |
| Age Structure | |||
| Population under 15 | 30.2% | 33.6% | 33.6% |
| Population 15 to 64 | 62.3% | 60.6% | 59.9% |
| Population over 65 | 7.5% | 5.8% | 6.6% |
| Dependency Ratio | |||
| Per 100 (15-64) | 60.6 | 65.0 | 67.0 |
| Sex Ratio | |||
| Males per 100 females | 90.3 | 88.7 | 87.9 |
| Population Growth | |||
| Per annum | 1.33% | 1.21% | n/a |
| Labour Market | |||
| Unemployment rate (official) | n/a | n/a | 37.2% |
| Youth unemployment rate (official) 15-34 | n/a | n/a | 47.4% |
| Education (aged 20 +) | |||
| No schooling | 10.3% | 12.4% | 13.2% |
| Matric | n/a | 29.9% | 24.9% |
| Higher education | 13.7% | 11.4% | 12.8% |
| Household Dynamics | |||
| Households | 427 174 | 378 301 | 342 836 |
| Average household size | 3.4 | 3.5 | 3.7 |
| Female headed households | n/a | 49.1% | 49.9% |
| Formal dwellings | 95.8% | 93.2% | 92.0% |
| Housing owned | n/a | 69.8% | 58.1% |
| Household Services | |||
| Flush toilet connected to sewerage | 41.9% | 30.2% | 28.5% |
| Weekly refuse removal | 39.9% | 30.4% | 29.7% |
| Piped water inside dwelling | 38.1% | 19.5% | 23.3% |
| Electricity for lighting | 95.8% | 95.2% | 87.4% |
Financial Results
| All values: R'000 | 2024/25 | 2023/24 | 2022/23 | 2021/22 | 2020/21 |
| AUDIT OUTCOME | n/a | Clean audit | Financially unqualified | Clean audit | Financially unqualified |
| FINANCIAL PERFORMANCE | |||||
| Property rates | - | - | - | - | - |
| Service charges | 84 535 | 78 861 | 84 041 | 81 788 | 81 097 |
| Investment revenue | 72 255 | 63 637 | 49 039 | 26 831 | 23 740 |
| Transfers recognised - operational | 838 747 | 797 795 | 767 198 | 714 743 | 709 153 |
| Other own revenue | 52 976 | 50 143 | 69 063 | 36 858 | 32 695 |
| Total Revenue (excluding capital transfers and contributions) | 1 048 513 | 990 436 | 969 341 | 860 220 | 846 685 |
| Employee costs | 385 493 | 366 472 | 353 602 | 344 730 | 338 860 |
| Remuneration of councillors | 16 888 | 17 236 | 16 329 | 14 957 | 15 213 |
| Depreciation and amortisation | 101 230 | 97 620 | 90 567 | 84 230 | 84 623 |
| Finance charges | 240 | 59 | 116 | 211 | 115 |
| Inventory consumed and bulk purchases | 102 090 | 101 950 | 65 083 | 51 597 | 80 338 |
| Transfers and subsidies | - | - | - | - | 337 |
| Other expenditure | 422 143 | 428 243 | 377 343 | 381 229 | 305 100 |
| Total Expenditure | 1 028 084 | 1 011 580 | 903 040 | 876 955 | 824 586 |
| Surplus/(Deficit) | 20 429 | (21 143) | 66 301 | (16 735) | 22 099 |
| Transfers and subsidies - capital (monetary allocations) | 421 831 | 441 263 | 380 891 | 325 670 | 334 669 |
| Transfers and subsidies - capital (in-kind) | 155 | 1 912 | 68 | 148 | - |
| Surplus/(Deficit) after capital transfers & contributions | 442 415 | 422 032 | 447 260 | 309 083 | 356 768 |
| Share of surplus/(deficit) of associate | - | - | - | - | - |
| Surplus/(Deficit) for the year | 442 415 | 422 032 | 447 260 | 309 083 | 356 768 |
| CAPITAL EXPENDITURE & FUNDS SOURCES | |||||
| Capital expenditure | 483 858 | 458 852 | 399 071 | 346 025 | 381 733 |
| Transfers recognised - capital | 363 420 | (120 777) | 281 573 | 240 367 | 283 963 |
| Borrowing | - | - | - | - | - |
| Internally generated funds | 120 438 | 127 319 | 117 498 | 105 658 | 92 626 |
| Total sources of capital funds | 483 858 | 6 542 | 399 071 | 346 025 | 376 589 |
| FINANCIAL POSITION | |||||
| Total current assets | 781 147 | 703 699 | 709 824 | 619 647 | 515 901 |
| Total non current assets | 4 604 841 | 4 235 951 | 3 806 771 | 3 458 985 | 3 161 251 |
| Total current liabilities | 247 771 | 386 193 | 314 030 | 303 085 | 201 713 |
| Total non current liabilities | 131 004 | 118 742 | 107 541 | 128 035 | 62 938 |
| Community wealth/Equity | 5 007 213 | 4 434 715 | 4 095 024 | 3 647 512 | 3 412 502 |
| CASH FLOWS | |||||
| Net cash from (used) operating | 555 852 | 1 848 110 | 1 733 422 | 1 560 451 | 983 040 |
| Net cash from (used) investing | (469 806) | (472 589) | (485 824) | (393 953) | (451 290) |
| Net cash from (used) financing | - | - | - | - | - |
| Cash/cash equivalents at the year end | 666 779 | 1 956 254 | 1 741 298 | 1 593 764 | 885 640 |
| UNAUTHORISED, IRREGULAR, FRUITLESS & WASTEFUL EXPENDITURE | |||||
| Unauthorised expenditure | n/a | - | - | - | - |
| Irregular expenditure | n/a | 214 514 | 192 957 | 72 | 2 476 |
| Fruitless & wasteful expenditure | n/a | 64 | 4 075 | 1 403 | 701 |
| SOURCE | Audited Outcome A1 2026 Q1 | Audited Outcome A1 2026 Q1 | Audited Outcome A1 2026 Q1 | Audited Outcome A1 2024 | Audited Outcome A1 2023 |
Employment Statistics
| 2022/23 | 2021/22 | 2020/21 | 2019/20 | 2018/19 | |
| Employment | |||||
| Employment Costs (R’000) | 353 602 | 344 730 | 338 860 | 320 370 | 296 726 |
| Remuneration of councillors (R’000) | 16 329 | 14 957 | 15 213 | 15 155 | 14 190 |
| Total Employee Positions | 547 | 972 | 591 | 587 | 992 |
| Total Vacant Employee Positions | 19 | 395 | 20 | 20 | 455 |
| Total Vacancy Percentage | 3.47% | 40.64% | 3.38% | 3.41% | 45.87% |
| Managerial Positions – S54A and S56 | 7 | 7 | 7 | 7 | 7 |
| Vacant Managerial Positions – S54A and S56 | 2 | 2 | 1 | 2 | 1 |
| Managerial Positions - by organogram | 46 | 46 | 46 | 47 | 28 |
| Vacant Managerial Positions - by organogram | 17 | 17 | 19 | 18 | 2 |
Service Delivery Statistics
| 2022/23 | 2021/22 | 2020/21 | 2019/20 | 2018/19 | |
| Water | |||||
| Does the municipality provide? | Yes | Yes | Yes | Yes | Yes |
| Number of households and non-domestic customers to which provided | 163 902 | 159 802 | 159 802 | 151 251 | 148 848 |
| Number of domestic households/delivery points | 160 850 | 156 750 | 156 750 | 148 199 | 144 026 |
| Inside the yard | 69 087 | 64 987 | 64 987 | 59 488 | 57 846 |
| Less than 200m from yard | 85 711 | 85 711 | 85 711 | 85 711 | 83 180 |
| More than 200m from yard | 6 052 | 6 052 | 6 052 | 3 000 | 3 000 |
| Domestic households with access to free basic service | 5 240 | 4 888 | 4 888 | 4 888 | 36 422 |
| Electricity | |||||
| Does the municipality provide? | No | No | No | No | No |
| Number of households and non-domestic customers to which provided | 0 | 0 | 0 | 0 | 0 |
| Domestic households with access to free basic service | 0 | 0 | 0 | 0 | 0 |
| Sewerage and Sanitation | |||||
| Does the municipality provide? | Yes | Yes | Yes | Yes | Yes |
| Number of households and non-domestic customers to which provided | 97 364 | 95 819 | 95 819 | 93 759 | 89 617 |
| Number of households using: | |||||
| Flush toilet - public sewerage | 11 642 | 11 642 | 11 642 | 11 642 | 10 000 |
| Flush toilet - septic tank | 0 | 0 | 0 | 0 | 0 |
| Ventilated pit latrine | 84 486 | 82 941 | 82 941 | 80 881 | 78 381 |
| Bucket system | 0 | 0 | 0 | 0 | 0 |
| Other | 0 | 0 | 0 | 0 | 0 |
| Domestic households with access to free basic service | 5 240 | 4 888 | 4 888 | 4 888 | 36 422 |
| Solid Waste Services | |||||
| Does the municipality provide? | No | No | No | No | No |
| Number of households and non-domestic customers to which provided | 0 | 0 | 0 | 0 | 0 |
| Domestic households with access to free basic service | 0 | 0 | 0 | 0 | 0 |