 C
C
Municipalities
Cederberg Local Municipality (WC012)
Metropolitan, district, and local municipalities across South Africa.
Overview
Cederberg Local Municipality (WC012) delivers municipal services and manages local governance and development planning within its jurisdiction. It oversees municipal administration, service delivery operations, and local planning that supports infrastructure and community needs. This profile consolidates key public reference details for the municipality.
Geography, History & Economy
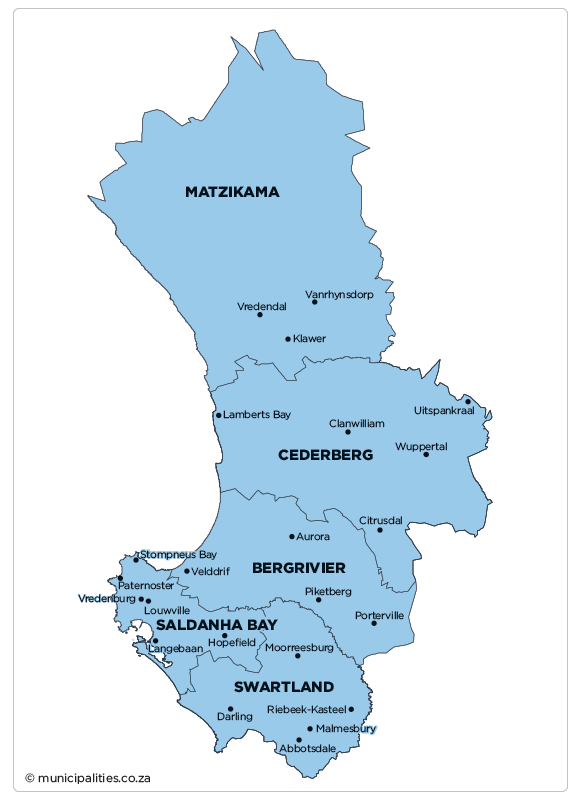
Cederberg Local Municipality is part of West Coast District Municipality .
MDB code: WC012
Description: The Cederberg Local Municipality is a Category B municipality located in the West Coast District along the upper west coast of the Western Cape Province, approximately 200km from Cape Town. The municipal area is bordered by the spectacular Cederberg Mountains in the east and the Atlantic Ocean in the west. It is one of five municipalities in the district. It is strategically located on the Cape-Namibia Corridor, and the N7 National Road links it with the Northern Cape. If this corridor was identified for future infrastructure upgrades and investments, it would be of paramount importance to ensure that the very basic infrastructure is in place to facilitate future development, whilst simultaneously planning for future growth. The municipality has its focus on the development of the rural poor and, in particular, investing in the youth and final year school-goers to secure their future. Due to its scenic natural beauty, ecotourism is considered a major future economic growth sector.
Area: 8 007km²
Cities/Towns: Citrusdal, Clanwilliam, Elands Bay, Graafwater, Lamberts Bay, Leipoldtville, Wupperthal
Main Economic Sectors: Agriculture, forestry and fishing (27%), mining and quarrying (18%), manufacturing (31%), electricity, gas and water (27%), construction (19%), wholesale and retail trade, catering and accommodation (25%), transport, storage and communication (23%). As contribution to GVA - Source IDP 2022
Open Tenders
View all →Map
Council & Management
Demographic Information
| 2022 | 2016 | 2011 | |
| Population | 55 108 | 52 949 | 49 768 |
| Age Structure | |||
| Population under 15 | 22.3% | 26.0% | 25.6% |
| Population 15 to 64 | 71.7% | 68.0% | 68.0% |
| Population over 65 | 6.1% | 6.0% | 6.4% |
| Dependency Ratio | |||
| Per 100 (15-64) | 39.5 | 47.0 | 47.0 |
| Sex Ratio | |||
| Males per 100 females | 96.5 | 102.3 | 100.9 |
| Population Growth | |||
| Per annum | 0.99% | 1.41% | n/a |
| Labour Market | |||
| Unemployment rate (official) | n/a | n/a | 10.5% |
| Youth unemployment rate (official) 15-34 | n/a | n/a | 13.8% |
| Education (aged 20 +) | |||
| No schooling | 3.3% | 5.7% | 7.7% |
| Matric | n/a | 23.2% | 19.4% |
| Higher education | 6.1% | 7.6% | 4.9% |
| Household Dynamics | |||
| Households | 15 912 | 15 279 | 13 513 |
| Average household size | 3.5 | 3.5 | 3.7 |
| Female headed households | n/a | 35.0% | 32.0% |
| Formal dwellings | 75.1% | 78.1% | 87.1% |
| Housing owned | n/a | 56.8% | 48.9% |
| Household Services | |||
| Flush toilet connected to sewerage | 88.3% | 83.0% | 82.6% |
| Weekly refuse removal | 71.4% | 68.6% | 57.8% |
| Piped water inside dwelling | 73.1% | 74.3% | 75.1% |
| Electricity for lighting | 87.3% | 90.3% | 88.8% |
Financial Results
| All values: R'000 | 2024/25 | 2023/24 | 2022/23 | 2021/22 | 2020/21 |
| AUDIT OUTCOME | n/a | Financially unqualified | Financially unqualified | Financially unqualified | Clean audit |
| FINANCIAL PERFORMANCE | |||||
| Property rates | 74 997 | 73 693 | 70 382 | 52 404 | 48 155 |
| Service charges | 215 962 | 190 639 | 169 309 | 171 807 | 151 562 |
| Investment revenue | 9 619 | 5 191 | 2 020 | 750 | 749 |
| Transfers recognised - operational | 105 686 | 115 113 | 90 589 | 96 033 | 77 735 |
| Other own revenue | 97 411 | 68 863 | 38 520 | 24 621 | 23 601 |
| Total Revenue (excluding capital transfers and contributions) | 503 674 | 453 498 | 370 820 | 345 615 | 301 802 |
| Employee costs | 138 386 | 130 819 | 124 857 | 132 380 | 123 803 |
| Remuneration of councillors | 6 355 | 6 081 | 5 698 | 5 000 | 5 572 |
| Depreciation and amortisation | 33 693 | 41 916 | 24 715 | 26 850 | 22 298 |
| Finance charges | 15 150 | 14 961 | 13 042 | 12 206 | 11 585 |
| Inventory consumed and bulk purchases | 137 531 | 116 430 | 103 046 | 102 223 | 89 258 |
| Transfers and subsidies | 164 | 198 | 358 | 244 | 489 |
| Other expenditure | 144 909 | 134 672 | 94 231 | 105 962 | 70 065 |
| Total Expenditure | 476 189 | 445 078 | 365 946 | 384 866 | 323 071 |
| Surplus/(Deficit) | 27 485 | 8 421 | 4 874 | (39 251) | (21 269) |
| Transfers and subsidies - capital (monetary allocations) | 37 781 | 26 461 | 43 139 | 46 106 | 42 135 |
| Transfers and subsidies - capital (in-kind) | - | 5 550 | - | 2 849 | - |
| Surplus/(Deficit) after capital transfers & contributions | 65 266 | 40 432 | 48 013 | 9 705 | 20 866 |
| Share of surplus/(deficit) of associate | - | - | - | - | - |
| Surplus/(Deficit) for the year | 65 266 | 40 432 | 48 013 | 9 705 | 20 866 |
| CAPITAL EXPENDITURE & FUNDS SOURCES | |||||
| Capital expenditure | 46 206 | 0 | - | 0 | (0) |
| Transfers recognised - capital | 27 053 | 8 822 | 19 262 | 35 462 | 41 023 |
| Borrowing | (5 346) | (13 003) | (2 802) | (3 242) | - |
| Internally generated funds | 24 498 | 3 790 | 2 077 | (2 307) | (14 183) |
| Total sources of capital funds | 46 206 | (391) | 18 537 | 29 914 | 26 841 |
| FINANCIAL POSITION | |||||
| Total current assets | 170 127 | 123 084 | 79 026 | 66 755 | 53 896 |
| Total non current assets | 706 070 | 684 008 | 757 906 | 734 370 | 725 409 |
| Total current liabilities | 117 279 | 105 357 | 117 376 | 133 723 | 114 940 |
| Total non current liabilities | 126 729 | 123 166 | 102 849 | 91 679 | 89 129 |
| Community wealth/Equity | 632 188 | 578 568 | 616 707 | 575 723 | 575 236 |
| CASH FLOWS | |||||
| Net cash from (used) operating | 327 570 | 322 930 | 183 609 | 207 715 | 5 182 |
| Net cash from (used) investing | (72 411) | (70 640) | (45 459) | (31 540) | (51 025) |
| Net cash from (used) financing | - | - | - | - | - |
| Cash/cash equivalents at the year end | 316 417 | 313 549 | 166 927 | 187 989 | (36 093) |
| UNAUTHORISED, IRREGULAR, FRUITLESS & WASTEFUL EXPENDITURE | |||||
| Unauthorised expenditure | n/a | 975 | 2 369 | - | 1 749 |
| Irregular expenditure | n/a | 16 604 | 36 233 | 35 204 | 12 794 |
| Fruitless & wasteful expenditure | n/a | 1 164 | 3 912 | 8 199 | 3 511 |
| SOURCE | Audited Outcome A1 2026 Q1 | Audited Outcome A1 2026 Q1 | Audited Outcome A1 2026 Q1 | Audited Outcome A1 2024 | Audited Outcome A1 2023 |
Employment Statistics
| 2022/23 | 2021/22 | 2020/21 | 2019/20 | 2018/19 | |
| Employment | |||||
| Employment Costs (R’000) | 124 857 | 132 380 | 123 803 | 108 883 | 95 900 |
| Remuneration of councillors (R’000) | 5 698 | 5 000 | 5 572 | 5 570 | 5 392 |
| Total Employee Positions | 370 | 361 | 350 | 341 | 362 |
| Total Vacant Employee Positions | 7 | 9 | 6 | 3 | 24 |
| Total Vacancy Percentage | 1.89% | 2.49% | 1.71% | 0.88% | 6.63% |
| Managerial Positions – S54A and S56 | 3 | 3 | 3 | 3 | 3 |
| Vacant Managerial Positions – S54A and S56 | 0 | 0 | 0 | 0 | 0 |
| Managerial Positions - by organogram | 21 | 21 | 21 | 21 | 21 |
| Vacant Managerial Positions - by organogram | 7 | 9 | 6 | 3 | 3 |
Service Delivery Statistics
| 2022/23 | 2021/22 | 2020/21 | 2019/20 | 2018/19 | |
| Water | |||||
| Does the municipality provide? | Yes | Yes | Yes | Yes | Yes |
| Number of households and non-domestic customers to which provided | 9 319 | 7 837 | 7 837 | 7 820 | 7 744 |
| Number of domestic households/delivery points | 8 819 | 7 337 | 7 337 | 7 320 | 7 244 |
| Inside the yard | 7 469 | 7 226 | 7 226 | 7 209 | 7 014 |
| Less than 200m from yard | 111 | 111 | 111 | 111 | 110 |
| More than 200m from yard | 1 239 | 0 | 0 | 0 | 120 |
| Domestic households with access to free basic service | 2 397 | 2 640 | 2 640 | 2 251 | 2 040 |
| Electricity | |||||
| Does the municipality provide? | Yes | Yes | Yes | Yes | Yes |
| Number of households and non-domestic customers to which provided | 8 695 | 8 123 | 7 873 | 7 873 | 8 305 |
| Domestic households with access to free basic service | 2 250 | 2 487 | 2 487 | 2 115 | 2 040 |
| Sewerage and Sanitation | |||||
| Does the municipality provide? | Yes | Yes | Yes | Yes | Yes |
| Number of households and non-domestic customers to which provided | 6 798 | 6 339 | 5 765 | 5 671 | 4 618 |
| Number of households using: | |||||
| Flush toilet - public sewerage | 5 167 | 5 074 | 4 854 | 4 780 | 4 112 |
| Flush toilet - septic tank | 487 | 487 | 512 | 512 | 127 |
| Ventilated pit latrine | 0 | 0 | 0 | 0 | 0 |
| Bucket system | 0 | 0 | 0 | 0 | 0 |
| Other | 765 | 399 | 20 | 0 | 0 |
| Domestic households with access to free basic service | 2 330 | 2 536 | 2 536 | 2 160 | 1 951 |
| Solid Waste Services | |||||
| Does the municipality provide? | Yes | Yes | Yes | Yes | Yes |
| Number of households and non-domestic customers to which provided | 10 775 | 5 948 | 5 948 | 5 873 | 5 512 |
| Domestic households with access to free basic service | 2 395 | 2 650 | 2 650 | 2 262 | 2 008 |