 C
C
Municipalities
Central Karoo District Municipality (DC5)
Metropolitan, district, and local municipalities across South Africa.
Overview
Central Karoo District Municipality (DC5) coordinates district-wide planning and supports service delivery and development across its local municipalities. It contributes to integrated development planning, infrastructure coordination, and district-level support where shared capacity improves outcomes. This profile provides a consolidated public reference and context for the district’s role.
Geography, History & Economy
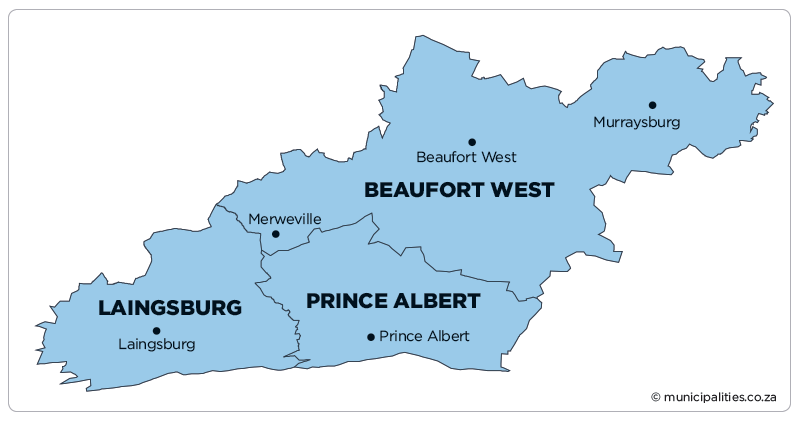
Central Karoo District Municipality comprises:
- Beaufort West Local Municipality
- Laingsburg Local Municipality
- Prince Albert Local Municipality
MDB code: DC5
Description: The Central Karoo District Municipality is a Category C municipality located in the Western Cape Province. It is bordered by the Pixley Ka Seme District Municipality in the north, Namakwa District Municipality in the north-west, Garden Route District Municipality in the south, Sarah Baartman District Municipality in the east and Cape Winelands District Municipality in the west. Central Karoo is the largest district in the province, making up a third of its geographical area. It is comprised of three local municipalities: Laingsburg, Prince Albert and Beaufort West. The seat of the district is Beaufort West.
Area: 38 854km²
Cities/Towns: Beaufort West, Klaarstroom, Laingsburg, Leeu Gamka, Matjiesfontein, Merweville, Murraysburg, Nelspoort, Prince Albert, Welgemoed
Main Economic Sectors: General government (20.74%), community, social and personal services (18.22%), agriculture, forestry and fishing (16.28%), finance, insurance, real estate, business (14.04%), wholesale and trade, catering and accommodation (11.06%), transport, storage and communication (10.03%), electricity, gas and water (3.88%), construction (3.18%), manufacturing (2.53%), mining and quarrying (0.03%). As contribution to GVA - Source IDP 2023/24
Open Tenders
View all →Map
Council & Management
Demographic Information
| 2022 | 2016 | 2011 | |
| Population | 102 173 | 74 247 | 71 011 |
| Age Structure | |||
| Population under 15 | 27.6% | 25.4% | 30.5% |
| Population 15 to 64 | 65.9% | 67.4% | 63.3% |
| Population over 65 | 6.5% | 7.2% | 6.2% |
| Dependency Ratio | |||
| Per 100 (15-64) | 51.8 | 48.3 | 58.0 |
| Sex Ratio | |||
| Males per 100 females | 92.0 | 93.8 | 95.9 |
| Population Growth | |||
| Per annum | 3.53% | 1.01% | n/a |
| Labour Market | |||
| Unemployment rate (official) | n/a | n/a | 23.1% |
| Youth unemployment rate (official) 15-34 | n/a | n/a | 30.9% |
| Education (aged 20 +) | |||
| No schooling | 5.2% | 5.8% | 10.1% |
| Matric | n/a | 29.5% | 21.5% |
| Higher education | 6.7% | 3.2% | 7.0% |
| Household Dynamics | |||
| Households | 27 290 | 21 980 | 19 075 |
| Average household size | 3.7 | 3.4 | 3.7 |
| Female headed households | n/a | 40.8% | 38.2% |
| Formal dwellings | 98.8% | 97.8% | 97.0% |
| Housing owned | n/a | 68.1% | 56.9% |
| Household Services | |||
| Flush toilet connected to sewerage | 97.5% | 93.7% | 89.1% |
| Weekly refuse removal | 81.5% | 90.8% | 78.7% |
| Piped water inside dwelling | 87.1% | 73.8% | 77.2% |
| Electricity for lighting | 96.6% | 95.1% | 89.4% |
Financial Results
| All values: R'000 | 2024/25 | 2023/24 | 2022/23 | 2021/22 | 2020/21 |
| AUDIT OUTCOME | n/a | Financially unqualified | Financially unqualified | Financially unqualified | Clean audit |
| FINANCIAL PERFORMANCE | |||||
| Property rates | - | - | - | - | - |
| Service charges | - | - | - | - | - |
| Investment revenue | 1 475 | 1 705 | 1 298 | 805 | 785 |
| Transfers recognised - operational | 47 733 | 45 691 | 42 994 | 43 010 | 41 119 |
| Other own revenue | 66 070 | 74 042 | 69 166 | 61 241 | 58 022 |
| Total Revenue (excluding capital transfers and contributions) | 115 278 | 121 438 | 113 458 | 105 055 | 99 926 |
| Employee costs | 68 741 | 67 829 | 62 400 | 53 435 | 49 170 |
| Remuneration of councillors | 5 640 | 4 975 | 4 829 | 3 879 | 3 777 |
| Depreciation and amortisation | 1 025 | 789 | 939 | 1 015 | 758 |
| Finance charges | 789 | 843 | 834 | 741 | 894 |
| Inventory consumed and bulk purchases | 14 453 | 14 106 | 12 599 | 11 252 | 9 132 |
| Transfers and subsidies | 234 | 1 199 | 1 533 | 2 933 | 1 054 |
| Other expenditure | 24 907 | 33 448 | 34 569 | 26 329 | 28 839 |
| Total Expenditure | 115 789 | 123 188 | 117 703 | 99 584 | 93 624 |
| Surplus/(Deficit) | (512) | (1 750) | (4 245) | 5 471 | 6 302 |
| Transfers and subsidies - capital (monetary allocations) | 430 | - | - | - | - |
| Transfers and subsidies - capital (in-kind) | - | - | - | - | - |
| Surplus/(Deficit) after capital transfers & contributions | (82) | (1 750) | (4 245) | 5 471 | 6 302 |
| Share of surplus/(deficit) of associate | - | - | - | - | - |
| Surplus/(Deficit) for the year | (82) | (1 750) | (4 245) | 5 471 | 6 302 |
| CAPITAL EXPENDITURE & FUNDS SOURCES | |||||
| Capital expenditure | 3 663 | 2 041 | 1 005 | 2 152 | - |
| Transfers recognised - capital | 3 214 | 1 937 | 837 | 4 | - |
| Borrowing | - | - | - | - | - |
| Internally generated funds | 449 | 104 | 168 | 2 149 | - |
| Total sources of capital funds | 3 663 | 2 041 | 1 005 | 2 152 | - |
| FINANCIAL POSITION | |||||
| Total current assets | 23 460 | 19 479 | 19 336 | 25 712 | 25 677 |
| Total non current assets | 19 240 | 16 836 | 14 462 | 16 354 | 15 674 |
| Total current liabilities | 23 227 | 12 888 | 9 506 | 11 847 | 16 918 |
| Total non current liabilities | 13 643 | 13 281 | 13 173 | 14 806 | 14 491 |
| Community wealth/Equity | 5 911 | 11 896 | 15 364 | 9 943 | 9 943 |
| CASH FLOWS | |||||
| Net cash from (used) operating | 80 586 | (79 403) | (120 464) | 687 975 | - |
| Net cash from (used) investing | - | - | 273 | (22) | (172) |
| Net cash from (used) financing | - | - | - | - | - |
| Cash/cash equivalents at the year end | 93 273 | (68 038) | (107 262) | 709 832 | 21 707 |
| UNAUTHORISED, IRREGULAR, FRUITLESS & WASTEFUL EXPENDITURE | |||||
| Unauthorised expenditure | n/a | 6 759 | 6 128 | 12 731 | 70 |
| Irregular expenditure | n/a | 3 517 | 18 373 | 6 670 | - |
| Fruitless & wasteful expenditure | n/a | 17 | 10 | 178 | 1 |
| SOURCE | Audited Outcome A1 2026 Q1 | Audited Outcome A1 2026 Q1 | Audited Outcome A1 2026 Q1 | Audited Outcome A1 2024 | Audited Outcome A1 2023 |
Employment Statistics
| 2022/23 | 2021/22 | 2020/21 | 2019/20 | 2018/19 | |
| Employment | |||||
| Employment Costs (R’000) | 62 400 | 53 435 | 49 170 | 54 177 | 45 742 |
| Remuneration of councillors (R’000) | 4 829 | 3 879 | 3 777 | 3 845 | 3 659 |
| Total Employee Positions | 180 | 172 | 163 | 152 | 163 |
| Total Vacant Employee Positions | 23 | 23 | 3 | 0 | 0 |
| Total Vacancy Percentage | 12.78% | 13.37% | 1.84% | 0.00% | 0.00% |
| Managerial Positions – S54A and S56 | 3 | 3 | 3 | 3 | 3 |
| Vacant Managerial Positions – S54A and S56 | 2 | 0 | 1 | 0 | 0 |
| Managerial Positions - by organogram | 11 | 11 | 11 | 11 | 10 |
| Vacant Managerial Positions - by organogram | 3 | 2 | 2 | 0 | 0 |
Service Delivery Statistics
| 2022/23 | 2021/22 | 2020/21 | 2019/20 | 2018/19 | |
| Water | |||||
| Does the municipality provide? | No | No | No | No | No |
| Number of households and non-domestic customers to which provided | 0 | 0 | 0 | 0 | 0 |
| Number of domestic households/delivery points | 0 | 0 | 0 | 0 | 0 |
| Inside the yard | 0 | 0 | 0 | 0 | 0 |
| Less than 200m from yard | 0 | 0 | 0 | 0 | 0 |
| More than 200m from yard | 0 | 0 | 0 | 0 | 0 |
| Domestic households with access to free basic service | 0 | 0 | 0 | 0 | 0 |
| Electricity | |||||
| Does the municipality provide? | No | No | No | No | No |
| Number of households and non-domestic customers to which provided | 0 | 0 | 0 | 0 | 0 |
| Domestic households with access to free basic service | 0 | 0 | 0 | 0 | 0 |
| Sewerage and Sanitation | |||||
| Does the municipality provide? | No | No | No | No | No |
| Number of households and non-domestic customers to which provided | 0 | 0 | 0 | 0 | 0 |
| Number of households using: | |||||
| Flush toilet - public sewerage | 0 | 0 | 0 | 0 | 0 |
| Flush toilet - septic tank | 0 | 0 | 0 | 0 | 0 |
| Ventilated pit latrine | 0 | 0 | 0 | 0 | 0 |
| Bucket system | 0 | 0 | 0 | 0 | 0 |
| Other | 0 | 0 | 0 | 0 | 0 |
| Domestic households with access to free basic service | 0 | 0 | 0 | 0 | 0 |
| Solid Waste Services | |||||
| Does the municipality provide? | No | No | No | No | No |
| Number of households and non-domestic customers to which provided | 0 | 0 | 0 | 0 | 0 |
| Domestic households with access to free basic service | 0 | 0 | 0 | 0 | 0 |